Andon Systems for Downtime Visibility
Andon Systems for Downtime Visibility
When a machine stops, the clock starts. Every minute it stays down is lost output, and the single biggest factor in how long a stop lasts is often not the repair itself but how long it takes the right person to find out. A jam at the far end of a long line can sit for ten minutes because the maintenance technician is on the other side of the building and nobody told them. The problem was fixable in two minutes. The delay was the real loss.
An andon system exists to remove that delay. The word comes from the Japanese for "lantern," and in manufacturing it means a visual and audible signal that tells everyone nearby, instantly, that something needs attention. Born in lean manufacturing and the Toyota Production System, andon has evolved from a simple pull cord and a light into connected systems that detect stops automatically, notify people by phone, escalate when nobody responds, and record every event for analysis. This guide explains how andon systems work, how to design one that improves downtime visibility, and how to connect it to the data you need to prevent repeat stops.
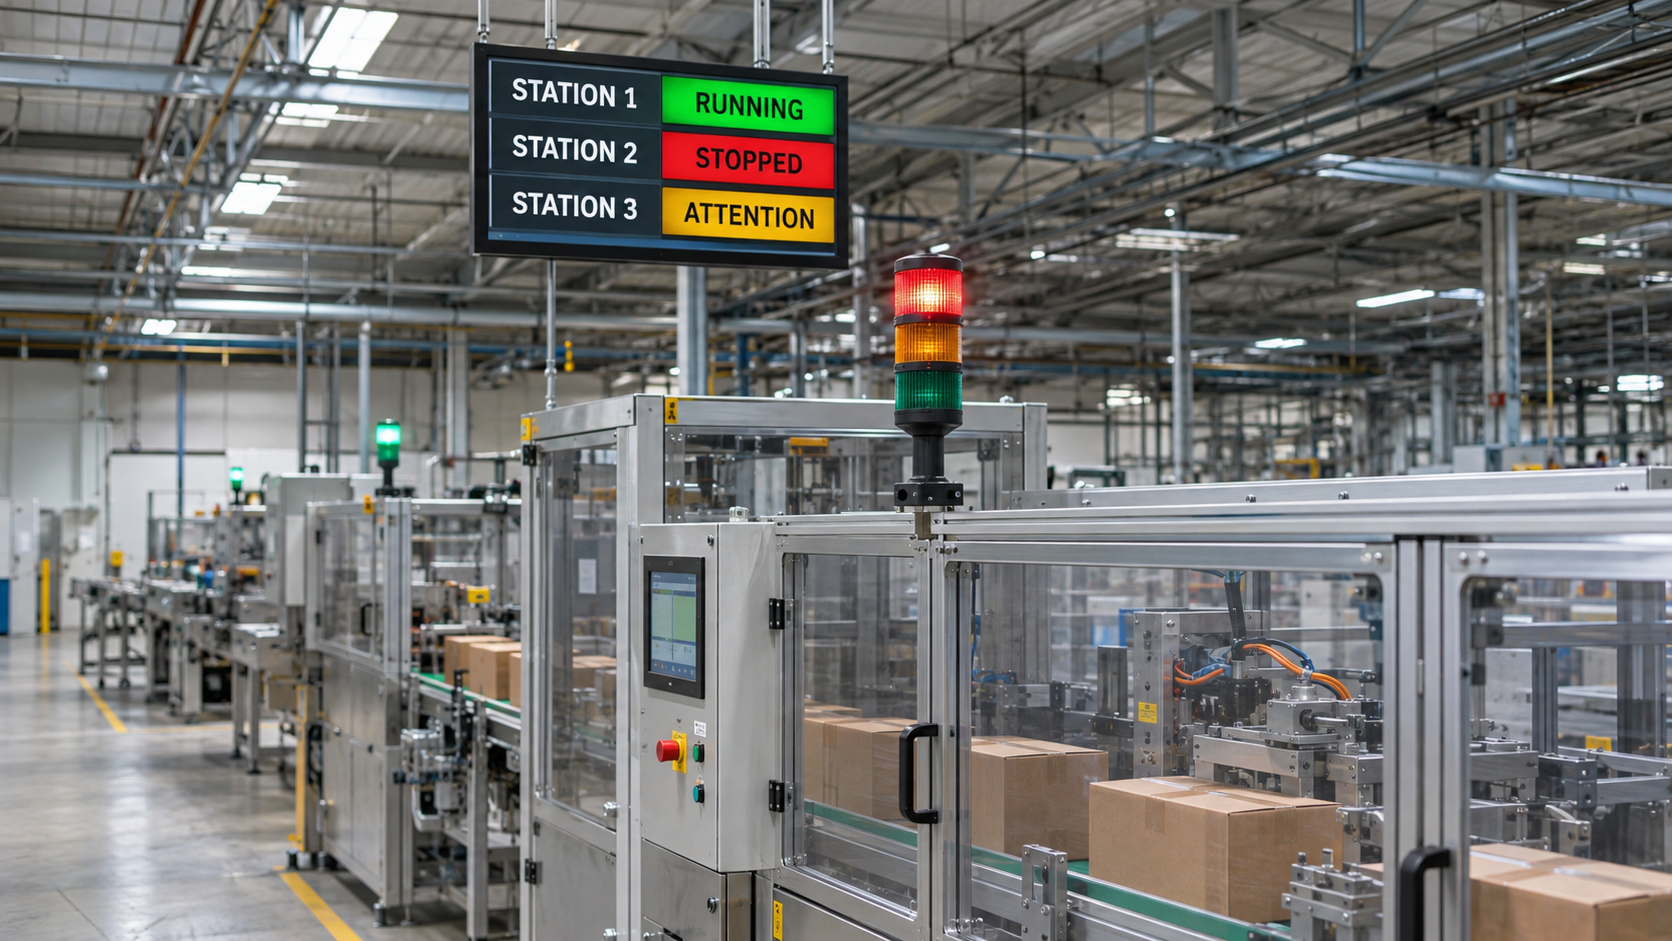
Suggested hero image: stack light tower and overhead andon board above a production line.
What Is an Andon System?
An andon system is a mechanism for making problems visible the moment they occur. At its simplest, it has three parts: a way to raise a signal, a way to display it, and a defined response.
- Signal. Someone or something declares a problem. This can be an operator pressing a button or pulling a cord, or a machine signal such as a fault, a stop, or a missed cycle.
- Display. The signal becomes visible and audible: a colored stack light on the machine, a large overhead board, a screen in the maintenance shop, a text message to a phone.
- Response. A defined person or team knows what to do when they see it, and the system tracks whether they did.
The philosophy behind it is just as important as the hardware. Andon says that a problem should stop the line and bring help quickly, rather than being hidden, worked around, or passed downstream. When that culture is in place, the technology multiplies its effect. When it is not, even the best andon board becomes decoration.
Why Andon Improves Downtime Visibility
Downtime visibility means that everyone who can influence a stop knows about it immediately, understands what it is, and can see the pattern over time. Andon supports each of those.
- Instant awareness. The problem is announced in seconds, not discovered at the next walk-through or reported at the end of the shift.
- Shared view. Operators, supervisors, maintenance, and managers all look at the same information, which reduces finger-pointing and phone tag.
- Faster response. When the right person is notified directly, the gap between the stop and the first action shrinks.
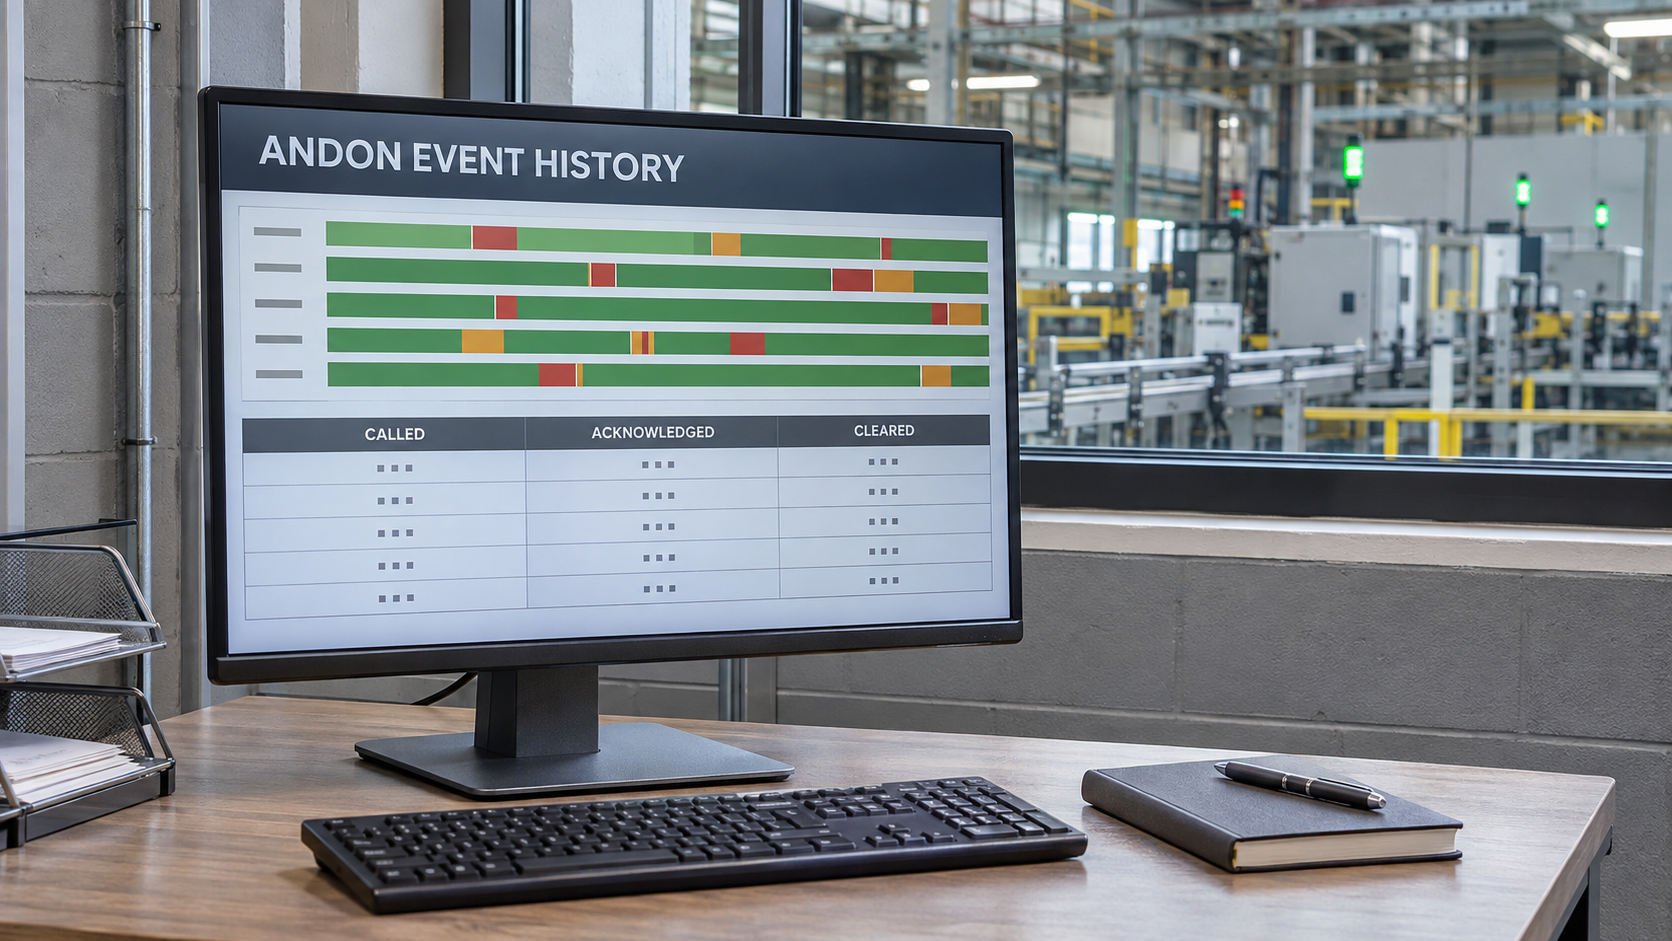
- Accountability without blame. The system records when a call was raised, when it was acknowledged, and when it was cleared, so you can see where delays happen and fix the process instead of the person.
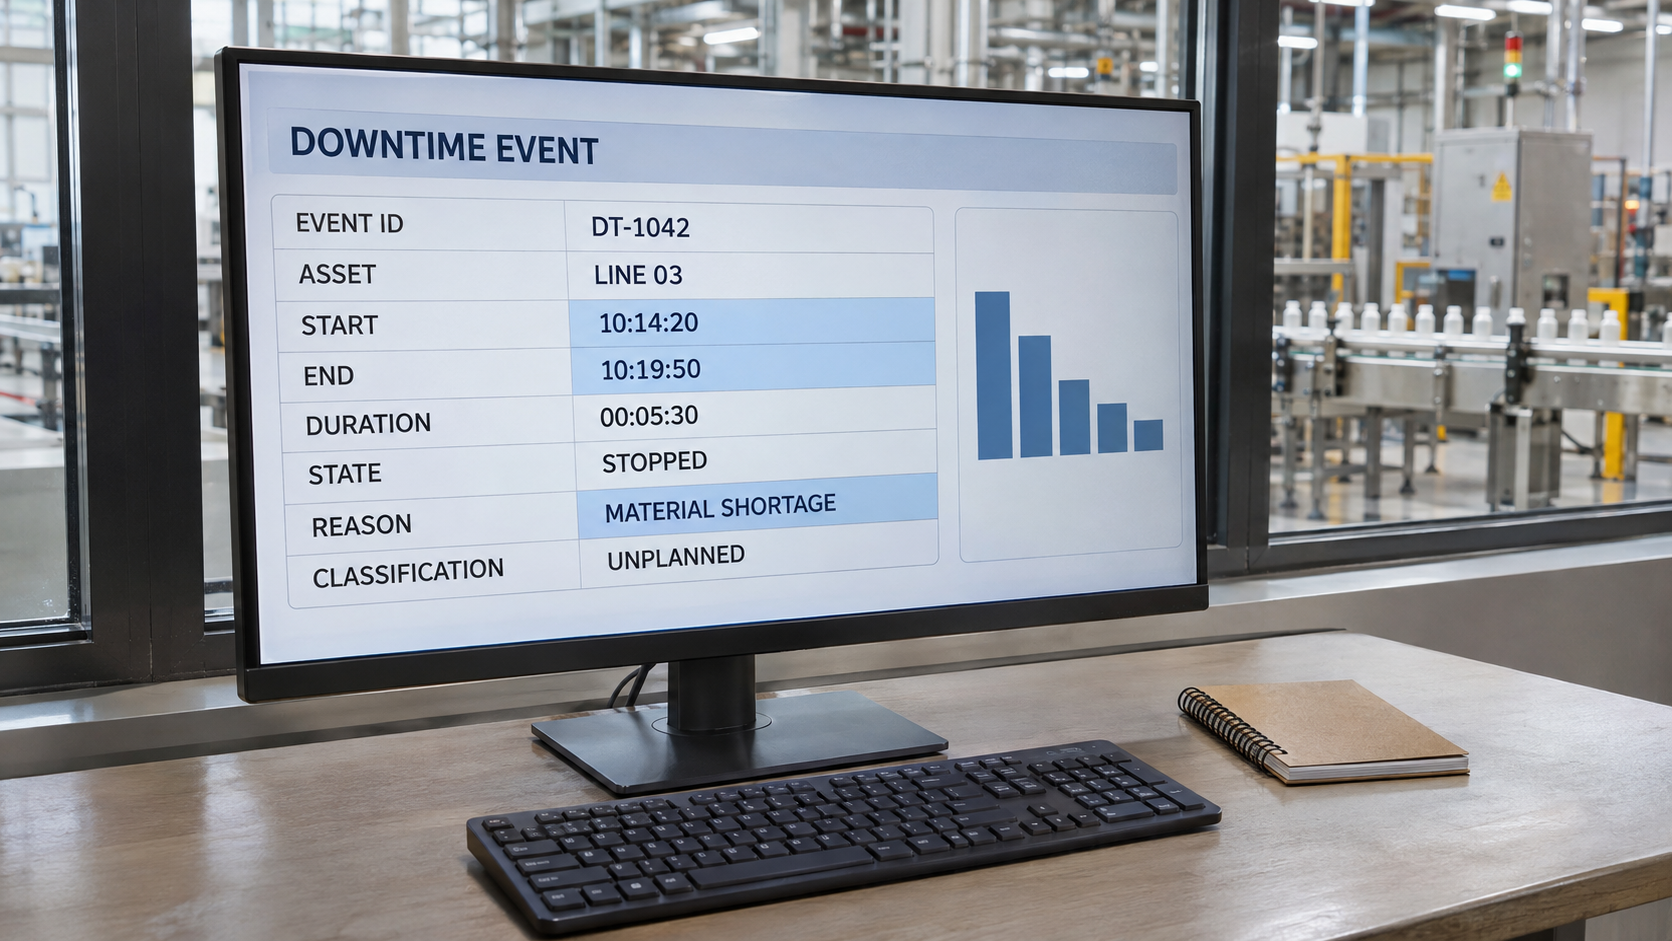
- Better data. Every andon event is a timestamped record with a location and a category, which feeds directly into downtime analysis.
Plants that adopt andon often find that the first benefit is not fewer breakdowns. It is that stops become shorter, because response time falls, and that hidden recurring problems finally become obvious because they are now on display.
The Core Components of an Andon System
A complete andon installation typically combines hardware, software, and procedure.
- Stack lights and signal towers. Colored lamps, usually mounted on top of a machine, show its state at a glance. They are the most recognizable andon element and the easiest to add to older equipment.
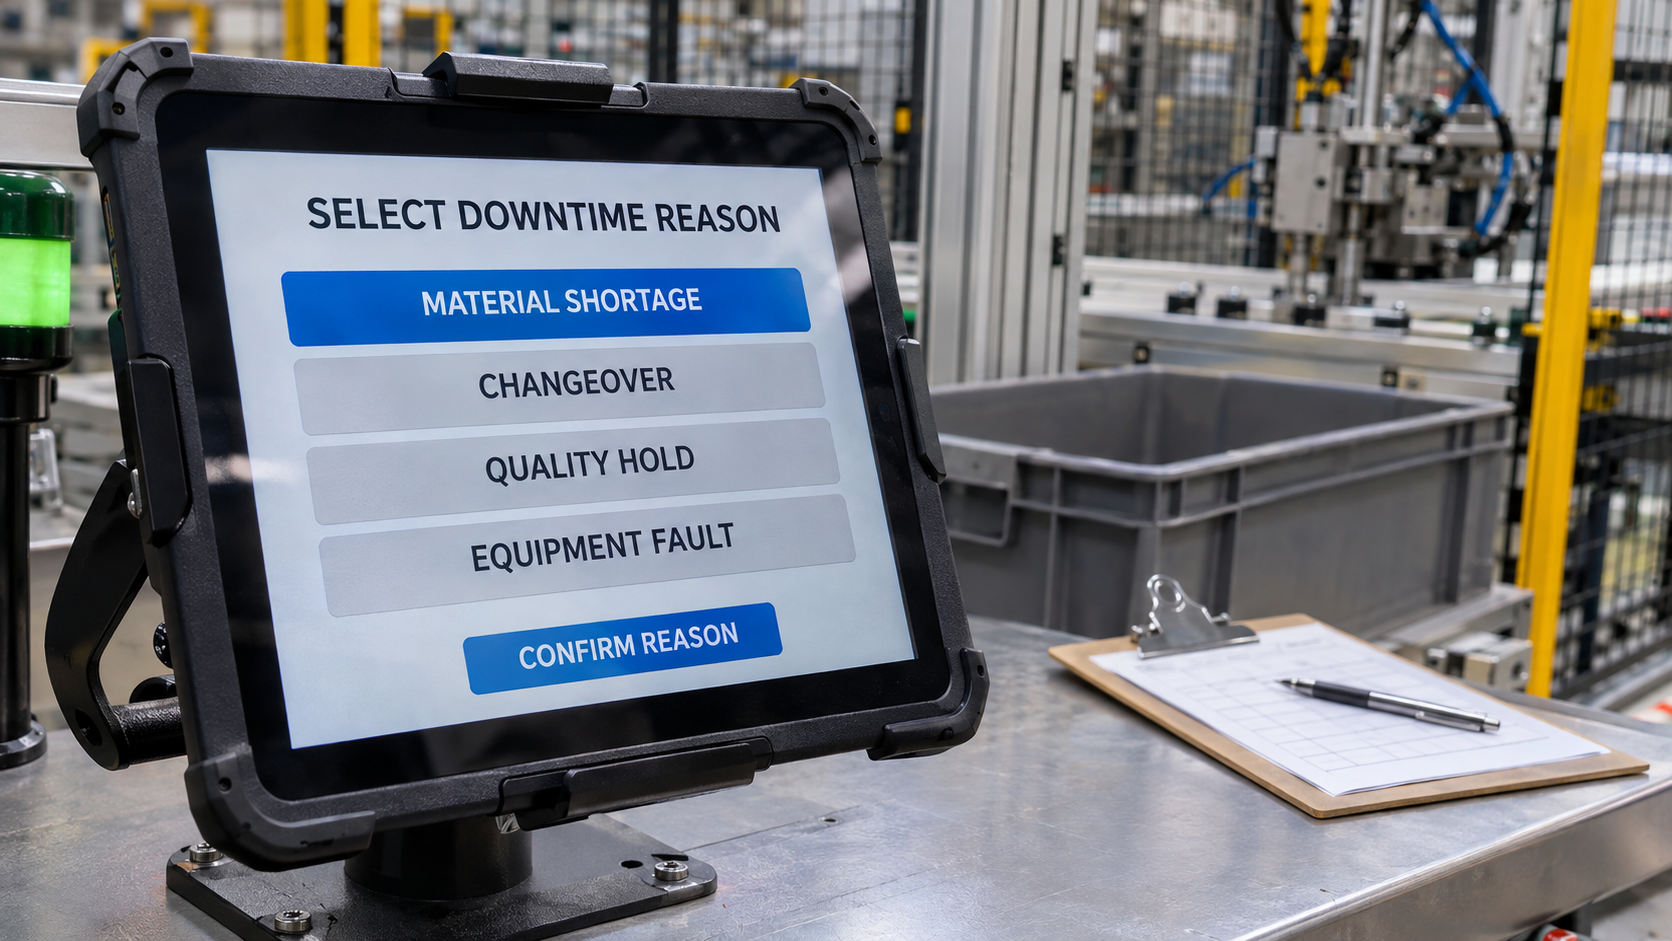
- Call buttons and pull cords. Let operators request help for specific needs: maintenance, material, quality, or supervisor.
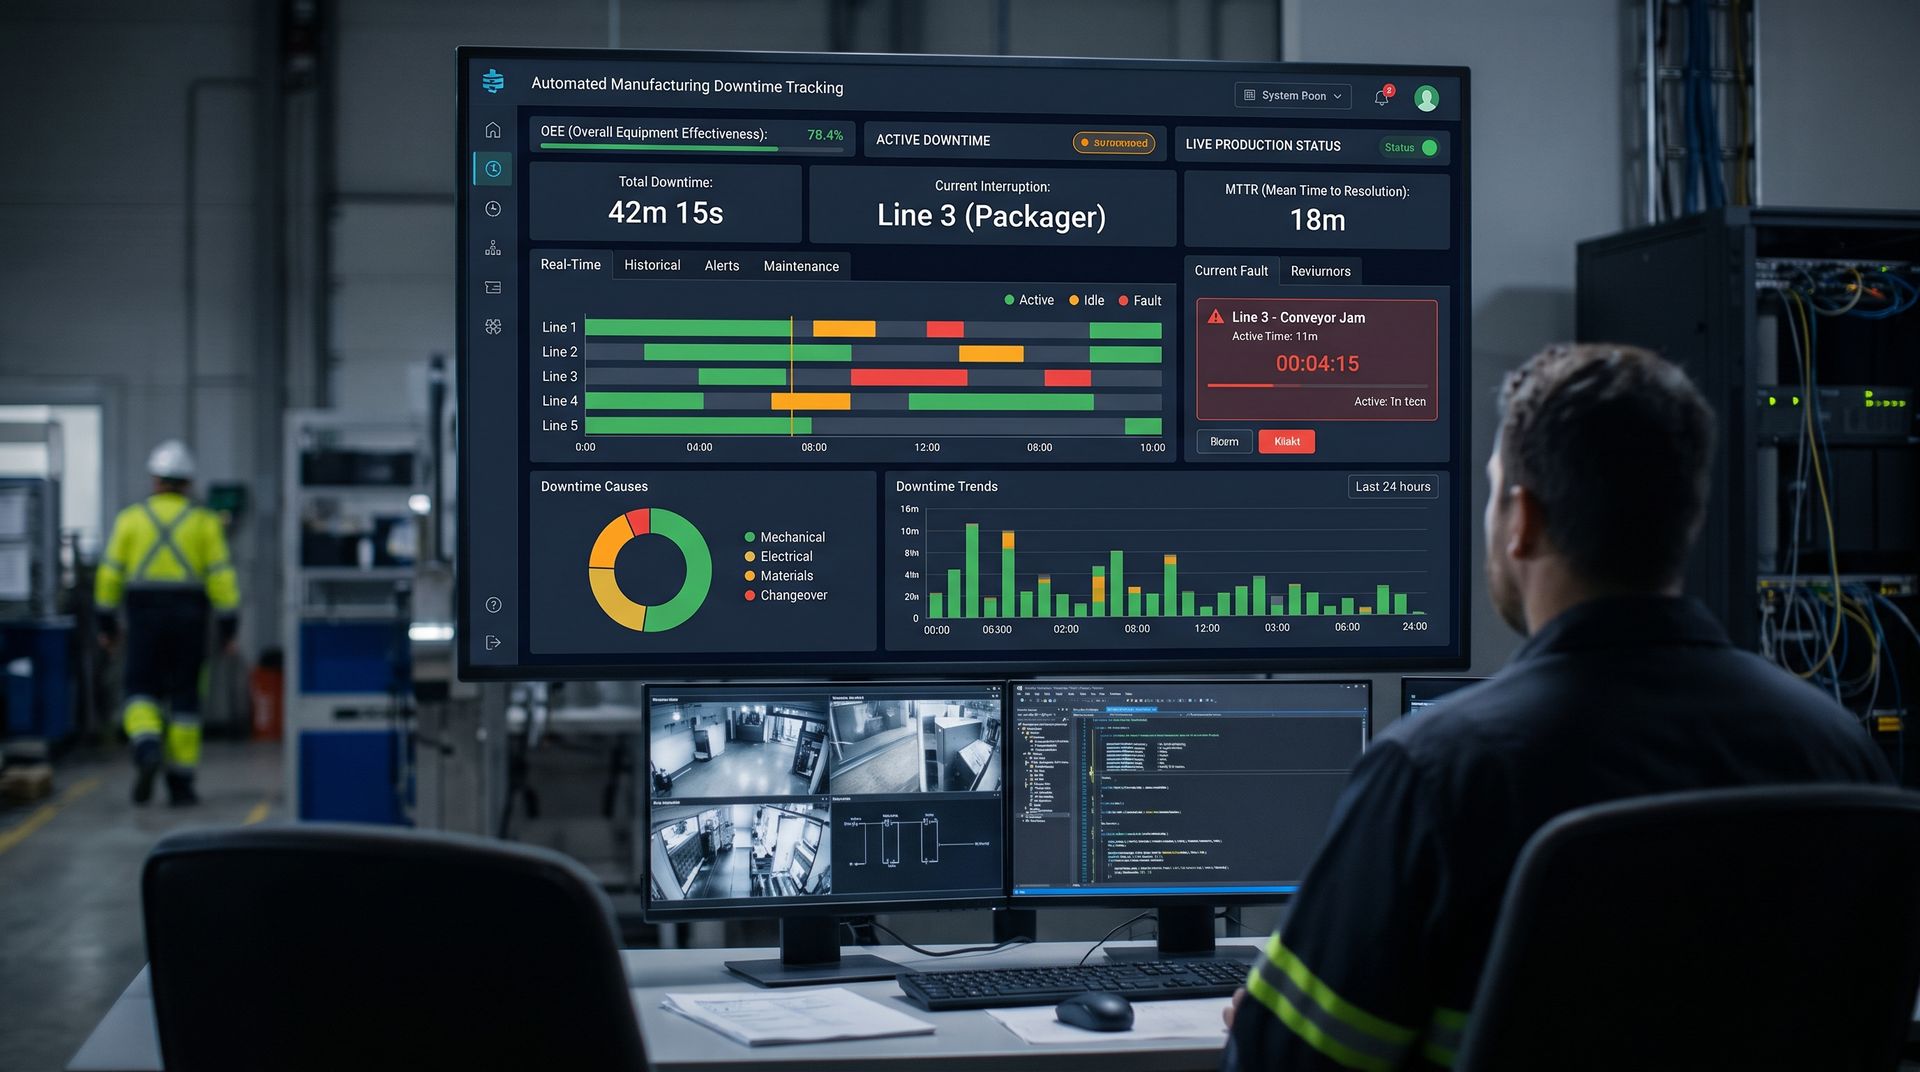
- Andon boards and large displays. Overhead screens or light boards show the status of every station on a line, which zones are in trouble, and for how long.
- Audible alerts. Horns, tones, or music (some plants use a different melody per problem type) catch attention when lights are out of sight.
- Controllers and software. The logic layer that receives signals, applies rules, drives displays, sends notifications, escalates, and logs events.
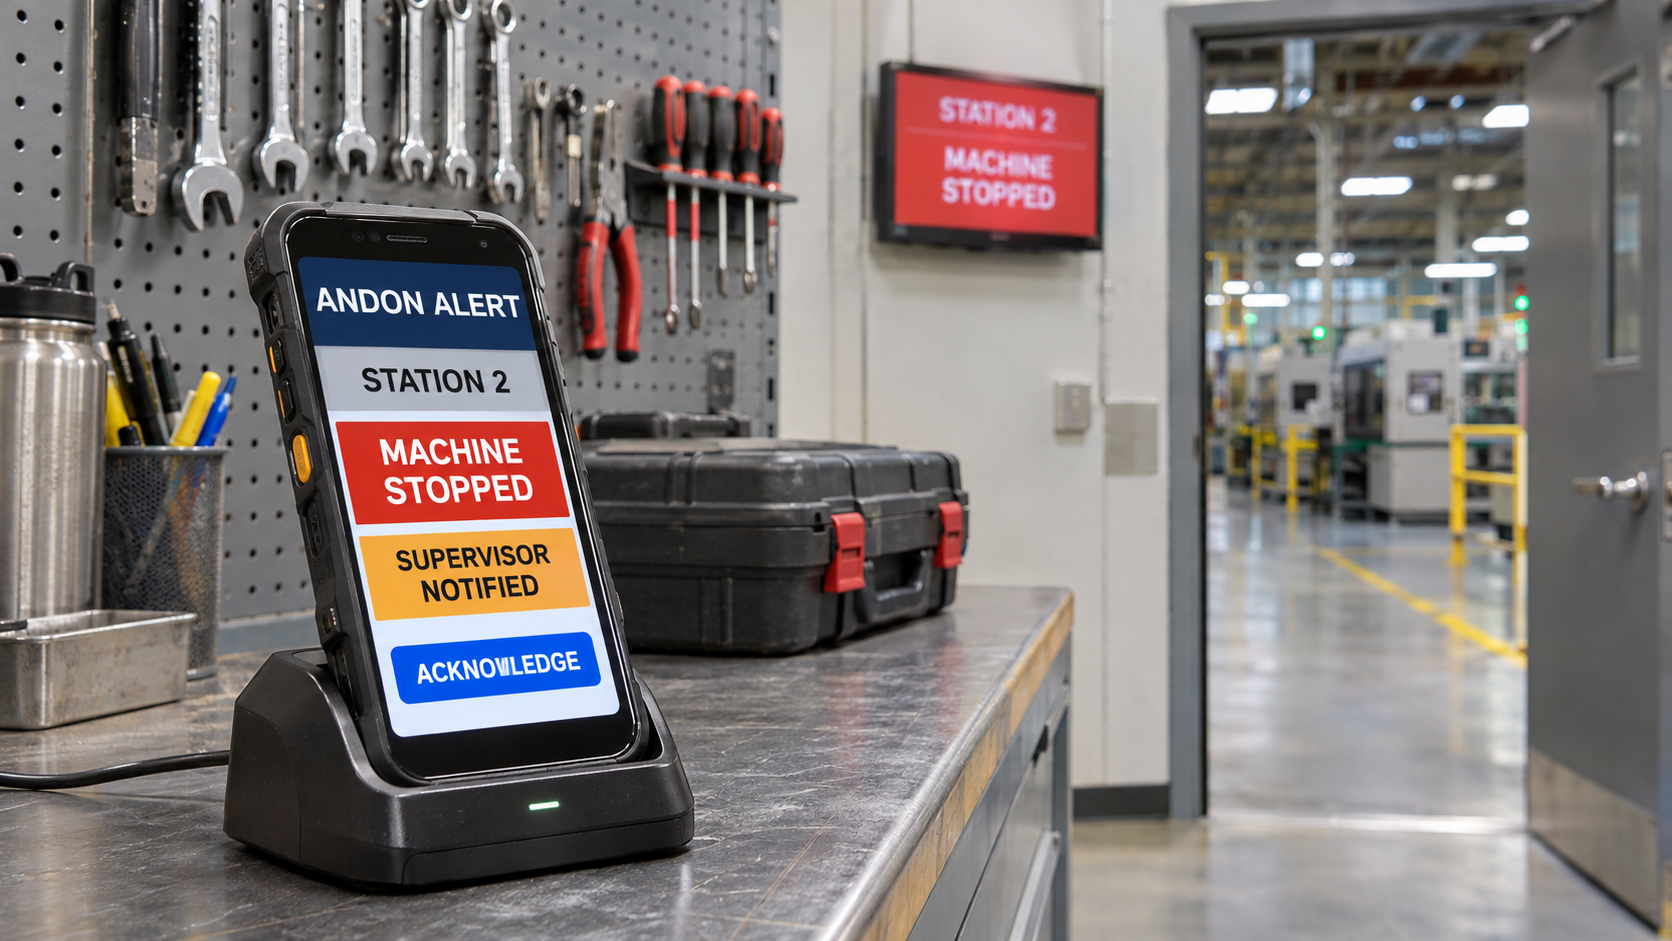
- Mobile notifications. Text, email, or app alerts that reach people who are away from their desks or out of sight of the board.
- Data connection. Links to PLCs, SCADA, and a historian so machine faults can raise andon calls automatically and andon events can be stored with process data.
Manual, Automatic, and Hybrid Andon
There are three broad ways to trigger andon calls, and most successful systems combine them.
Manual andon. The operator initiates the call with a button, cord, or touchscreen. This captures problems a machine cannot sense on its own, such as a quality concern, a missing part, or an unsafe condition. Its weakness is that it depends on a person remembering to do it.
Automatic andon. The system raises the call from machine signals: a fault, an E-stop, a blocked or starved condition, a cycle that has run long, or a speed drop. It never forgets and responds in seconds, but it can only report what the machine can detect.
Hybrid andon. Machine signals trigger a call automatically, and the operator adds context with a quick selection or a second call for something the machine cannot see. This gives you speed from automation and judgment from people, and it is the most common pattern in modern plants.
Suggested in-article image: diagram showing manual, automatic, and hybrid andon triggers feeding one andon board.
Color Codes and What They Should Mean
Stack lights work best when colors mean the same thing across the entire plant. A common convention looks like this, though you should define your own and then keep it consistent.
- Green: running normally.
- Yellow or amber: warning, attention needed, or a condition developing, such as low material or a changeover in progress.
- Red: stopped or faulted, immediate help needed.
- Blue: an assist call, such as material delivery, quality check, or a maintenance request in progress.
- White: a defined plant-specific status, such as a machine waiting on an operator or a first-article inspection.
A few rules keep the system readable. Limit the number of colors in use. Post a legend near every station. Do not let different lines use different meanings. Add flashing or audible patterns only for the highest priority conditions so urgency stays meaningful. If you want to apply the same discipline to your alarm design, the principles overlap with how operators read alarm lists on an HMI.
Designing Triggers That Support Downtime Tracking
The quality of your andon data depends on the triggers you define. Some principles to follow:
- Trigger on stops, not just failures. Include blocked, starved, idle, and waiting conditions so you see the whole picture of lost production, not just breakdowns.
- Use a minimum duration. A one-second hiccup should not page maintenance. Choose a threshold that filters noise while catching real problems, and consider different thresholds for different machines.
- Differentiate call types. Separate maintenance, material, quality, and supervisor calls so the right team responds and the data is categorized from the start.
- Include planned states. Changeovers, breaks, and scheduled maintenance should show as such, not as red alarms.
- Tie to fault codes. When a machine reports why it stopped, pass that along with the call so responders arrive with context.
Good triggers are the bridge between the shop floor display and your downtime analysis. If the call types match your downtime reason categories, you get consistent data without asking operators to enter the same information twice.
Escalation: What Happens When Nobody Responds
An andon call that nobody answers is just a light. Escalation rules are what make the system dependable.
A typical escalation ladder looks like this:
- Immediate: the line lead and the on-duty maintenance technician are notified the moment the call is raised.
- After a set time with no acknowledgment: the maintenance supervisor is notified.
- After a longer period or for critical assets: the production manager and plant leadership are notified.
- For safety or quality events: the appropriate safety or quality lead is notified immediately, regardless of timers.
Define acknowledgment clearly. The responder should confirm that they are on the way, and the system should record that time. Then record arrival and clearance. Those three timestamps, called, acknowledged, and cleared, give you response time and repair time separately, which is the most useful way to see where delays are hiding. A solid alarm logging and notification tool can handle routing, acknowledgments, and escalation without anyone building a manual call tree.
Where to Place Displays So People Actually See Them
Visibility is a physical problem as much as a software one. A beautiful board nobody can see does not help.
- At the machine. A stack light on top of each machine, visible from the aisle, tells operators and walking supervisors the state without looking at a screen.
- At the line. An overhead board visible from every station shows which workstations are in trouble.
- At the support teams. Put a repeater display in the maintenance shop, the tool crib, and the supervisor office, so responders see calls even when they are not on the floor.
- In their pocket. Mobile notifications cover the gaps, such as night shifts, large facilities, and outdoor or remote areas.
- In the meeting room. A summary view for the daily production meeting turns andon from a reaction tool into a continuous improvement tool.
Check sightlines by walking the floor at different times of day. Glare, forklifts, racking, and ceiling height all change what is visible from where.
Connecting Andon to Your Historian and Downtime Data
Andon becomes far more powerful when it is connected to the same data platform that stores your process values. A data historian captures every andon event with a timestamp alongside the machine signals around it, which lets you answer questions the board alone cannot:
- How often does this station call for help, and at what time of day?
- Which call types take the longest to resolve?
- What was the machine doing in the minutes before a recurring stop?
- Is response time worse on certain shifts, or on certain days?
- Did a fix we made last month actually reduce calls?
That connection also supports automatic calls. When your data layer already reads PLC faults and states, it can raise andon calls without a separate set of wiring, and it can attach the fault description so the first responder knows where to start. A data connector layer makes it practical to bring in machines from different vendors into one andon view.
The Metrics Andon Makes Possible
Once andon events are logged, you can track a useful set of measurements.
- Call frequency by station, shift, and call type.
- Response time: raised to acknowledged, which reflects how well the notification and staffing process works.
- Time to repair: acknowledged or arrived to cleared, which reflects technical capability, spares, and procedure.
- Total downtime per call type, to feed a Pareto of top losses.
- Repeat calls, the same station and same cause appearing again, which signal problems that were patched but not solved.
- Escalation rate, how often calls climb the ladder, which can reveal understaffing or unclear ownership.
Use these numbers to find where to focus, not to rank individuals. If response time is long on night shift, the answer is probably staffing or coverage, not a lecture.
Suggested in-article image: bar chart of andon calls by type with response and repair times.
Implementing an Andon System Step by Step
1. Pick a pilot area. Choose a line where downtime hurts and the team is open to change. Prove it there first.
2. Map the current response. Walk through what happens today when a machine stops: who finds out, how, and how long it takes. That is your baseline.
3. Define call types and colors. Keep it simple and agree on meanings with operators, maintenance, and quality.
4. Choose triggers. Decide which are automatic, which are manual, and what minimum durations apply.
5. Build escalation rules and ownership. Name who responds to what, how fast, and who is next in line.
6. Install hardware and connect to data. Add stack lights, buttons, and boards, and link them to PLC signals and your historian.
7. Train everyone and set expectations. Operators need to know they are encouraged to call. Responders need to know the target response time. Leaders need to show support by actually responding.
8. Review weekly. Look at the top call types, response times, and repeat issues, and assign fixes.
9. Expand. Once the pilot works, roll it out to other lines using what you learned.
Common Andon Pitfalls
- Alert fatigue. Too many low-value calls teach people to ignore the board. Tune thresholds and remove noise.
- Punishing the caller. If operators fear criticism for stopping the line or calling for help, they will stop calling. Reward early escalation.
- No real response. A call that nobody answers destroys trust in the whole system.
- Unclear ownership. If it is not obvious who responds to which call, everyone assumes someone else will.
- Inconsistent colors and meanings. Different areas using different codes confuses people who move between lines.
- Hardware without process. Lights and screens do not change behavior. Procedures and leadership do.
- No follow-through on root causes. Fixing the same stop every day is not improvement. Use the repeat-call data to eliminate it.
Andon Versus Alarm Management
Andon and industrial alarms overlap but are not the same. Alarms come from the process and the control system and tell operators about conditions that need attention. Andon is a team-level mechanism for calling help and making problems visible across the floor. The best plants connect them: relevant control alarms feed andon calls so support teams are notified, while andon does not replace the alarm philosophy that keeps operators safe and effective. Keep alarm priorities clean and rationalized, so what reaches andon is meaningful and not a flood.
Real-Time Monitoring and Industrial Visibility
Andon is one layer of broader real-time monitoring across the plant. Machine status, production counts, and fault codes collected from PLCs, SCADA systems, and IoT devices provide the underlying visibility, while andon boards and mobile alerts deliver it to people. Combining industrial data collection, dashboards, and notifications gives manufacturing teams a shared, current view of equipment performance, machine downtime, and production efficiency that supports lean manufacturing and continuous improvement.
How do andon systems improve downtime visibility?
Andon systems detect or announce a stop within seconds, display it on lights, boards, and mobile devices, and notify the right responder. Because each call is logged with start, acknowledgment, and clearance times, teams see not only that downtime happened but how fast they responded and which problems keep recurring.
Andon Systems for Downtime Visibility: A Quick Review
Use this review before you design or upgrade your system.
- Combine automatic machine triggers with operator calls, and match call types to downtime reason categories.
- Add escalation rules, log called, acknowledged, and cleared times, and review the data weekly.
Frequently Asked Questions About Andon Systems
1. What is the difference between an andon light and an andon system?
An andon light is a single signal device, usually a stack light on a machine. An andon system includes the triggers, displays, notifications, escalation rules, and data logging that turn those signals into a managed response process.
2. Can I add andon to older machines?
Yes. A stack light and a small I/O module reading a relay, limit switch, or existing indicator can give you automatic status on equipment that has no network. Operators can add manual call buttons for situations the machine cannot detect.
3. Should andon calls be automatic or manual?
Use both. Automatic triggers catch stops instantly and never forget. Manual calls capture quality concerns, missing material, and other issues a machine cannot sense. A hybrid approach gives the best coverage.
4. How do I prevent alert fatigue?
Set minimum durations so brief blips do not create calls, separate call types so only the relevant team is notified, and review the most frequent calls weekly to eliminate or fix the noisy ones.
5. What should I track to know if andon is working?
Track call frequency, response time, time to repair, repeat calls, and total downtime by call type. Falling response and repair times and shrinking repeat counts are the clearest signs of improvement.
6. Do I need a historian for andon?
Not to start, but it helps a great deal. A historian stores andon events alongside process data, which lets you analyze root causes, compare shifts, and confirm that fixes worked over time.
Make Downtime Visible with Empowered Automation Solutions
If stops in your plant are still discovered by walking past a silent machine, there is a faster way. Empowered Automation Solutions provides industrial data software that connects to your PLCs and plant-floor equipment, raises alarms and notifications based on real machine conditions, stores every event in a high-performance historian, and delivers live status to screens and mobile devices. Our engineers know controls, so we can help you pick the right triggers, connect equipment from different vendors, and design escalation that fits your crews.
Whether you are adding andon to your first line or standardizing across multiple sites, start with a conversation. Take advantage of our free connectivity assessment to see what your equipment can already tell you, or explore our HMI SCADA and visualization tools to see how live status can reach every person who needs it. The faster a stop is seen, the faster it is fixed.
You might also like