How to Track Downtime Automatically
How to Track Downtime Automatically
Every plant knows downtime costs money. Very few plants know exactly how much, where it happens, or why. Ask three shift supervisors how long Line 4 was down last week and you will often get three different answers, none of them matching the number in the weekly report. The gap between what people remember and what the machines actually did is where production hours quietly disappear.
Automatic downtime tracking closes that gap. Instead of relying on clipboards, whiteboards, and end-of-shift memory, you read machine signals directly from PLCs, controllers, and sensors, detect when equipment stops, record how long it stayed stopped, and attach a reason. The result is a precise, timestamped record of every stop, collected without anyone having to write it down. This guide walks through how to do it step by step: what to measure, how to connect to your equipment, how to turn raw signals into downtime events, and how to put that information in front of the people who can act on it.
Why Manual Downtime Tracking Falls Short
Manual tracking is where most plants start, and for a single machine with a dedicated operator it can work. As soon as you scale up, its weaknesses show.
- Short stops disappear. Operators are busy clearing jams and restarting equipment. A 40-second stop rarely makes it onto the log sheet, yet a dozen of them per shift can add up to hours of lost production.
- Times are estimated. "About 15 minutes" is usually rounded, remembered late, or filled in at the end of the shift. Rounded numbers hide patterns.
- Reasons are inconsistent. One operator writes "jam," another writes "material issue," a third writes "waiting." Without a shared list of reason codes, the data cannot be grouped or ranked.
- Data arrives late. Paper sheets get typed into spreadsheets days later. By the time anyone sees the trend, the problem has moved on or become a bigger one.
- It pulls people off the job. Every minute an operator spends documenting a stop is a minute not spent fixing it.
None of this is a criticism of operators. It is simply what happens when a measurement task is assigned to people whose real job is running the process. Automation takes the measurement part off their plate and leaves them the part only they can do: explaining why it happened.
What Automatic Downtime Tracking Actually Means
Automatic downtime tracking is a chain of four steps that happen without manual entry:
- Collect signals from machines: run status, speed, part counts, alarms, fault codes.
- Interpret those signals with rules that decide when the machine is running, idle, or stopped.
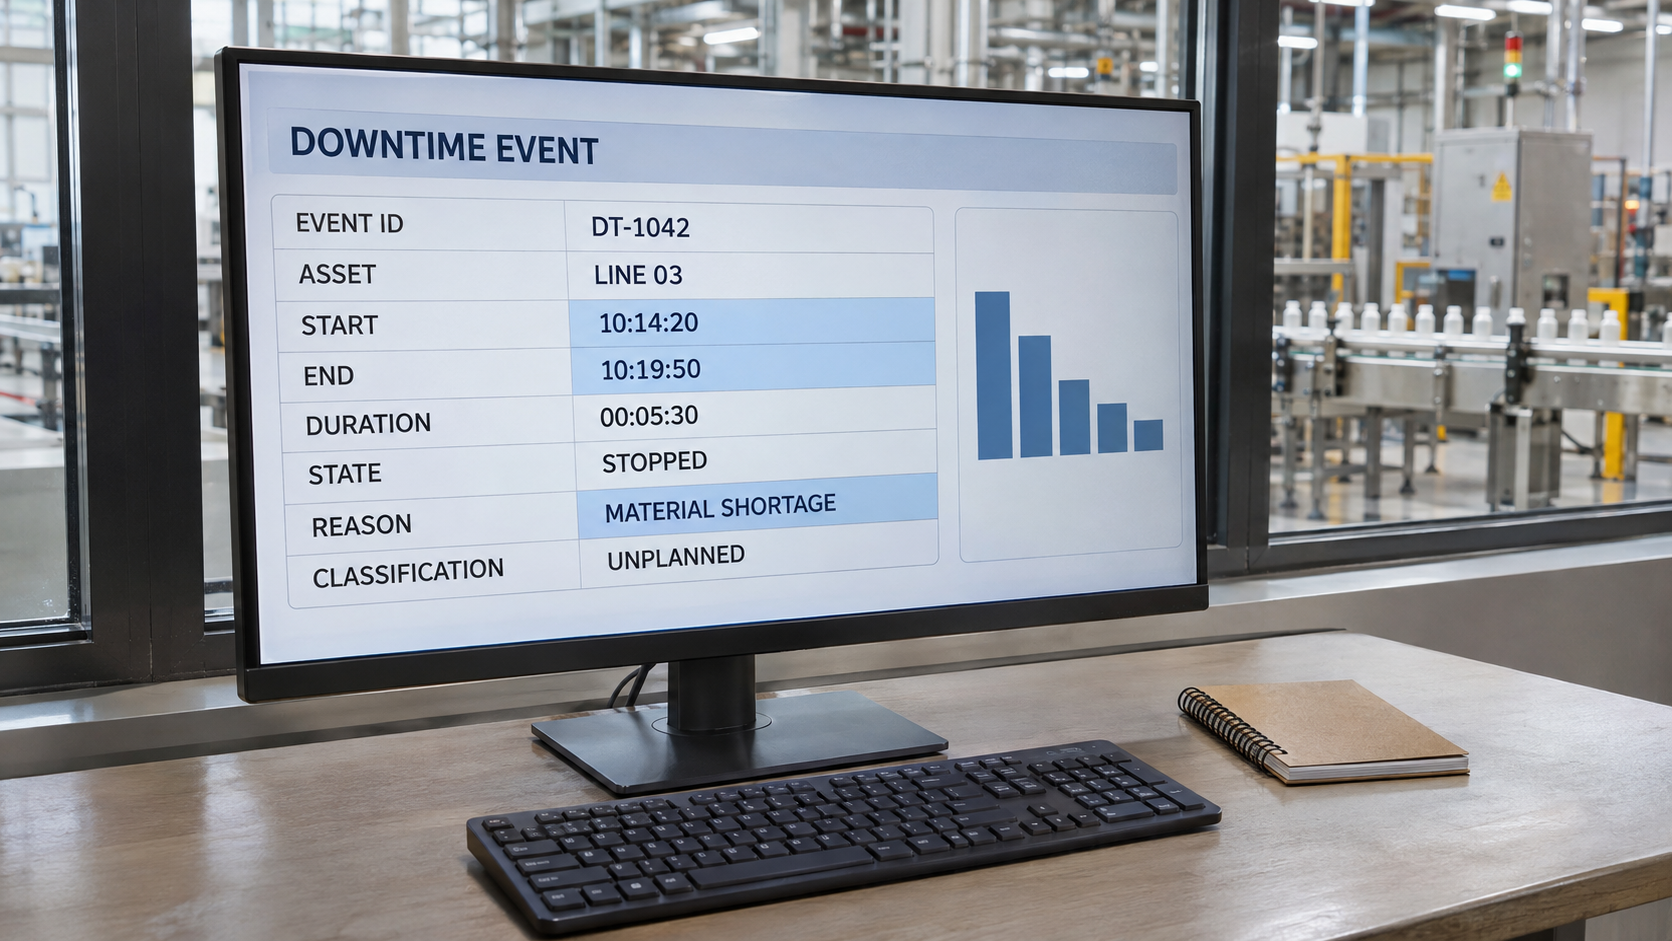
- Record each stop as an event with a start time, end time, duration, and asset.
- Contextualize the event with a reason, either detected automatically from a fault code or selected quickly by an operator.
The key idea is that the machine tells you when and how long, and a person tells you why only when the system cannot work it out alone. That division of labor gives you accurate time data on every stop, and good reason data on the stops that matter.
Step 1: Define What Counts as Downtime
Before you connect anything, write down your definitions. Teams that skip this step end up with software that faithfully records the wrong thing. Decide:
- What is a stop? Is a machine down when it is not producing, when it is faulted, or when the line is starved for material? Most plants track all three but separate them by category.
- What is the minimum duration? A common approach is to log every stop longer than a set threshold (for example, 30 seconds to 2 minutes) as a downtime event, and treat anything shorter as a micro-stop counted in a separate bucket.
- What is planned versus unplanned? Scheduled breaks, planned maintenance, and changeovers are real time lost, but they should be tagged so they do not get mixed into the unplanned downtime you are trying to eliminate.
- Which assets are in scope? Start with the constraint machine or the line that hurts most. You do not need to instrument the whole plant on day one.
Write these definitions on one page and get operations, maintenance, and quality to agree on them. Every number that follows will inherit these rules.
Step 2: Choose the Signals That Reveal Machine State
Most machines already produce the signals you need. The art is picking the smallest set that tells the truth. Useful signals include:
- Run/stop status bit. The simplest signal. True when the machine is in automatic run, false when it is not.
- Part or cycle counter. If the counter stops incrementing, the machine is not producing, even if the status bit still says running. Counters catch the "running but not making product" case.
- Speed or rate. Useful for detecting slow running, which is a loss even when the machine never fully stops.
- Alarm and fault codes. These often explain a stop on their own, which saves operators from having to enter a reason.
- Mode signals. Auto, manual, setup, and E-stop states help separate changeovers and maintenance from real faults.
- Upstream and downstream signals. Blocked or starved conditions tell you whether the problem is in this machine or somewhere else on the line.
A good rule of thumb: combine at least two signals, such as a status bit and a counter, so that one noisy or stuck tag does not give you false downtime.
Step 3: Connect to Your Equipment
This is the step that makes people nervous, but connecting to controllers is usually more straightforward than expected. You generally have three paths, depending on the age and type of equipment.
- Modern PLCs and controllers. Most speak open or well-documented protocols such as OPC UA, EtherNet/IP, Modbus TCP, or Siemens S7. A data connector layer can read tags directly and normalize them into one common structure.
- CNC and machine tools. Controllers such as FANUC can be read through OPC servers, FOCAS-based software, or MTConnect adapters, giving you state, program, and alarm information.
- Older equipment with no network. Add a small I/O module or gateway to read a relay, a stack light, or a limit switch. A stack light signal alone, green for running, amber for idle, red for fault, is enough to build useful downtime tracking on a machine that has no data port at all.
Whichever route you take, keep the collection network segmented from the enterprise network, use encrypted protocols where available, and avoid adding load to controllers by polling more often than you need. A one-second scan is plenty for downtime detection.
Suggested in-article image: diagram of PLCs and sensors feeding a data connector and historian.
Step 4: Turn Signals into Downtime Events
Raw signals are not downtime. You need logic that converts them into clean events. A typical rule set looks like this:
- Machine is RUNNING when the status bit is on and the part counter has incremented within the expected cycle window.
- Machine is STOPPED when the status bit is off, or when the counter has not moved for longer than a set multiple of the normal cycle time.
- A downtime event starts when the machine enters STOPPED and the state holds longer than the minimum duration.
- A downtime event ends when the machine returns to RUNNING and stays there for a short confirmation period.
Those confirmation periods, often called debounce time, matter more than people expect. Without them, a flickering signal produces dozens of false one-second events that bury the real ones. Test your logic against a week of real data and compare it with what supervisors remember. When the two disagree, investigate, because one of them is wrong, and it is not always the machine.
Step 5: Capture the Reason Without Slowing Anyone Down
Time data is automatic. Reason data needs a smart hybrid approach.
- Automatic reasons. If a fault code, alarm, or E-stop caused the stop, the system can assign the reason itself. Many stops fall into this group.
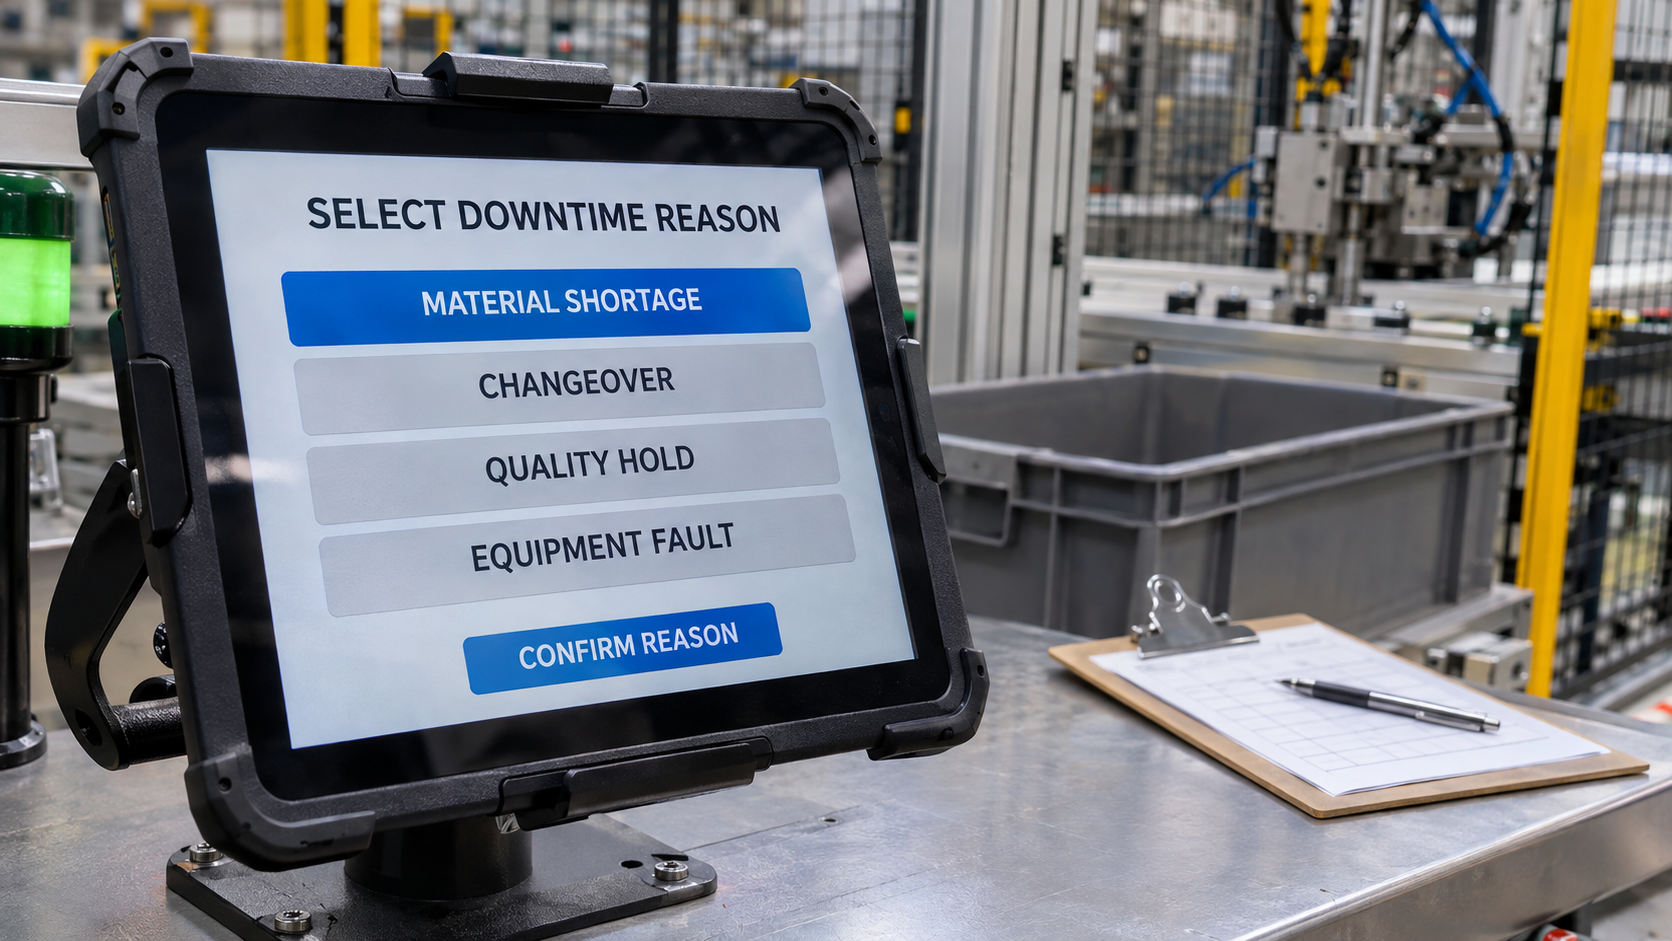
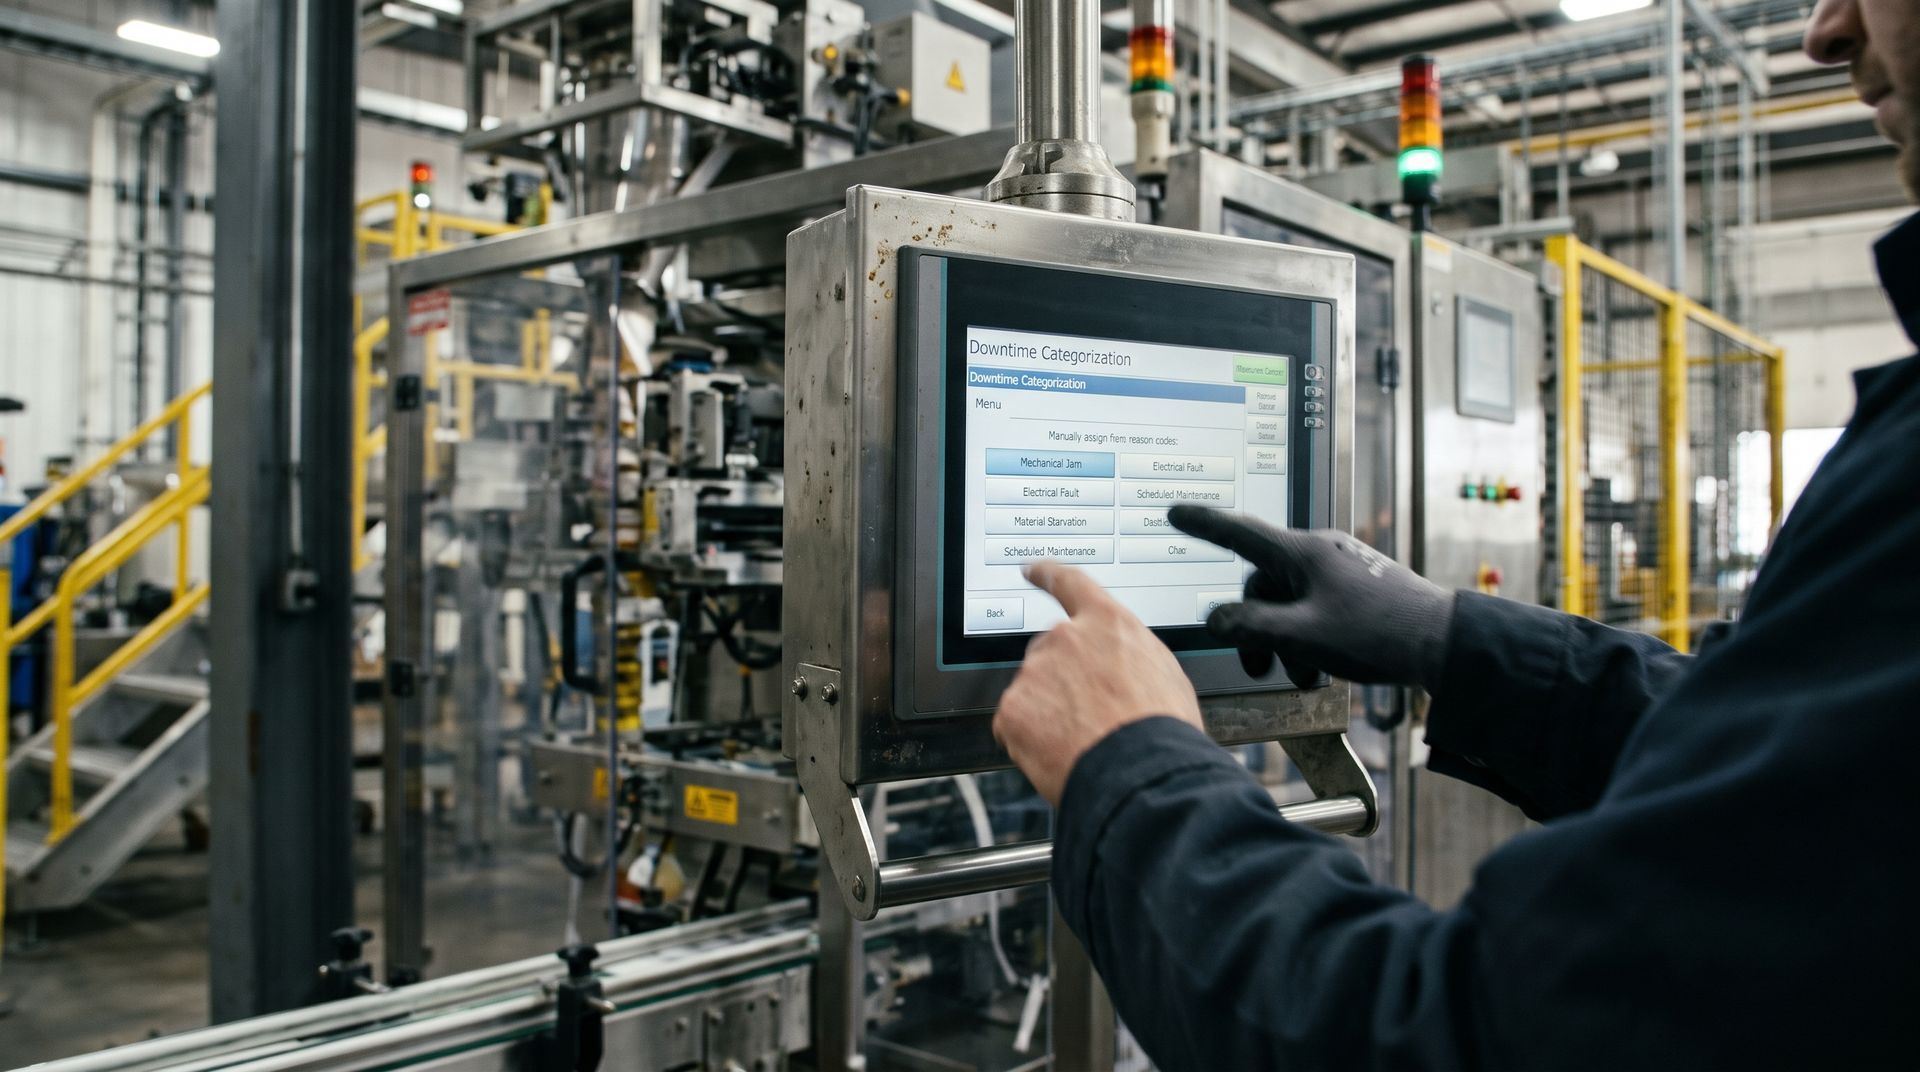
- Operator-selected reasons. For everything else, show the operator a short list of reason codes on an HMI, tablet, or touchscreen the moment the stop is detected. One or two taps, not a form.
- Hierarchical reason codes. Keep the first screen to about eight to ten broad categories, such as mechanical, electrical, material, changeover, quality, and operator. A second tap drills into specifics when needed.
- Default and timeout behavior. If nobody selects a reason, mark the event "unassigned" and flag it for review. Do not guess, and do not let unassigned time quietly pile up.
Keeping the list short is what makes this work. A reason list with 80 entries is a reason list nobody uses.
Step 6: Store Everything in a Historian
Downtime events are time-series data, and they deserve a proper home. A data historian stores every signal, state change, and event with a timestamp, so you can look back at exactly what the machine was doing before, during, and after a stop. That context is what turns a log of events into root cause analysis.
With a historian underneath your tracking, you can:
- Replay the process values leading up to a fault to see what changed.
- Compare downtime across shifts, products, and machines using the same consistent data.
- Keep years of history for trending, audits, and capital justification.
- Feed the same data to dashboards, reports, MES, and analytics tools without building separate collection for each.
If you want to understand the storage layer in more depth, see how a data historian fits between your controllers and the rest of your systems.
Step 7: Build Dashboards People Will Actually Use
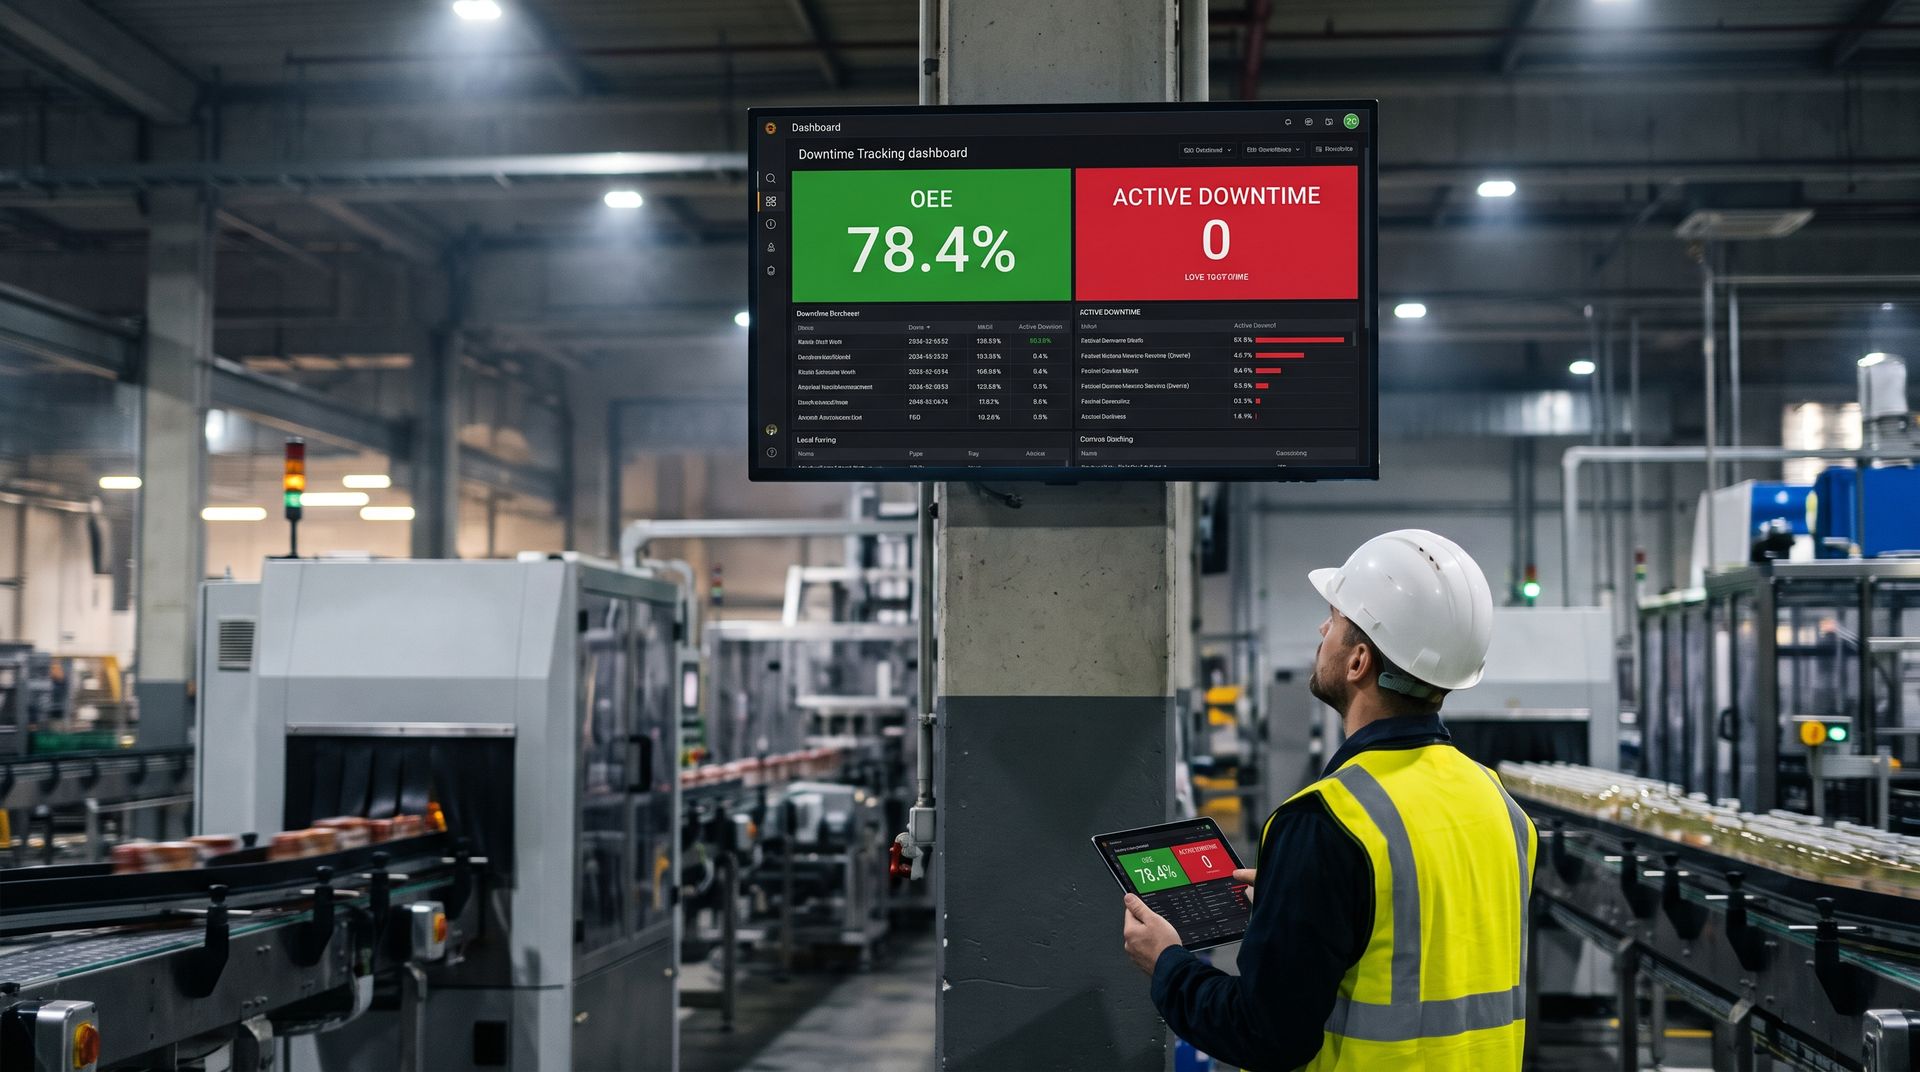
Data that sits in a database does not reduce downtime. Visibility does. Build a small number of focused views:
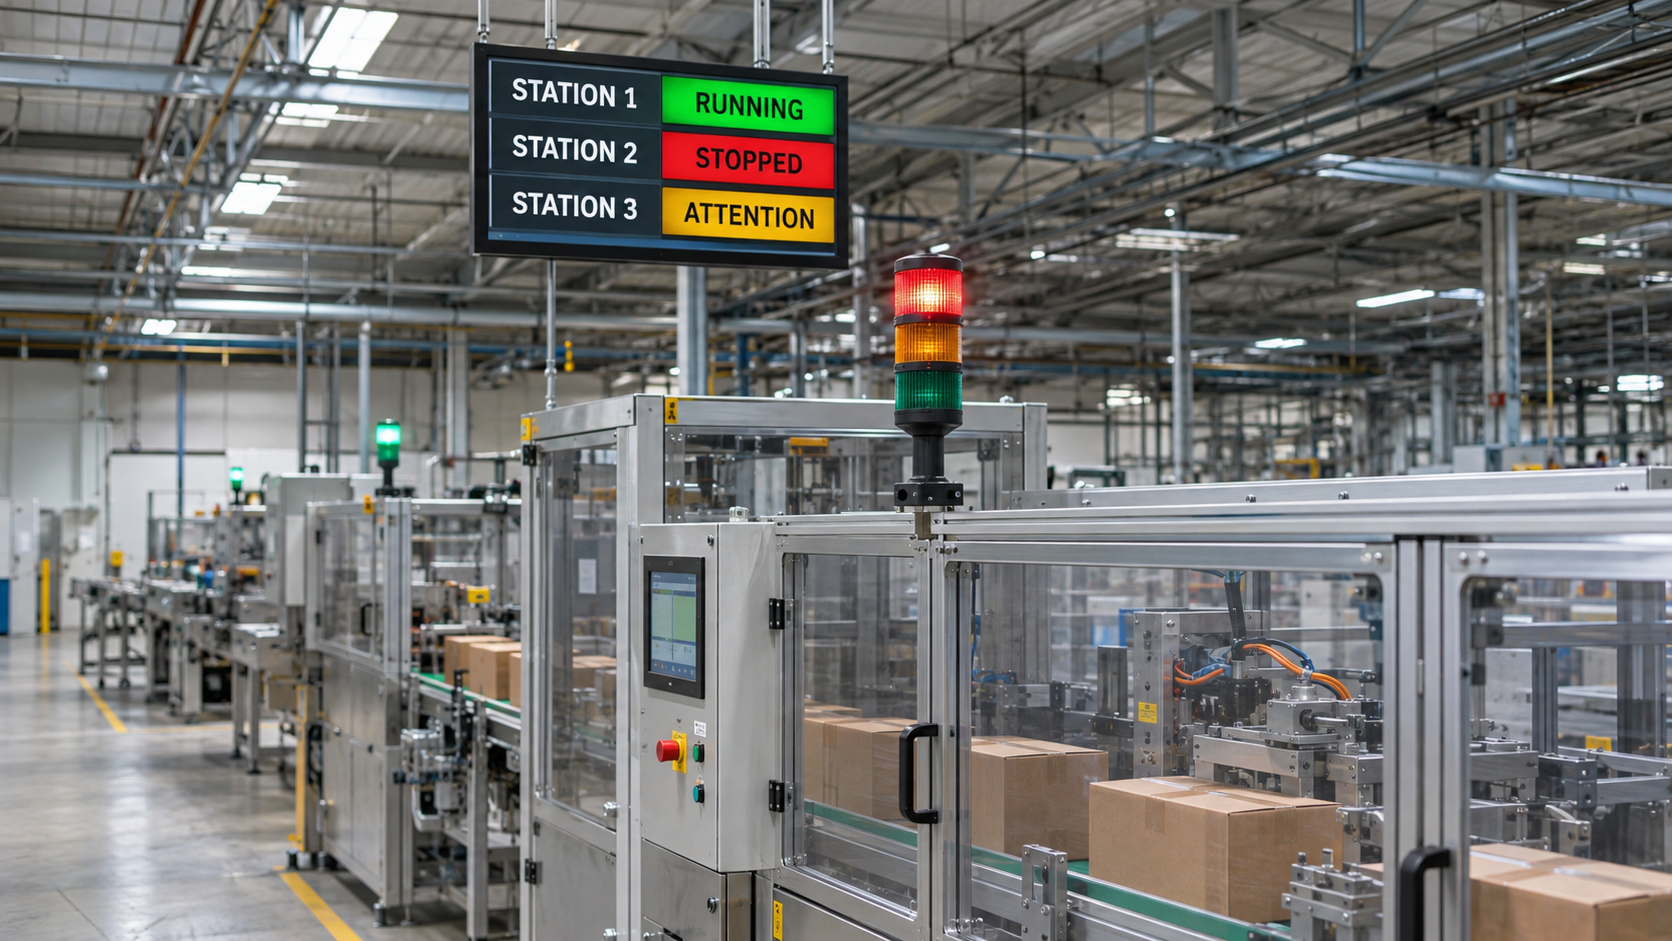
- Live line status. A big, simple display showing each machine as running, stopped, or idle, with how long it has been in that state. Put it where operators and supervisors can see it.
- Current shift summary. Total downtime, number of stops, longest stop, and top reasons so far.
- Pareto chart of reasons. Rank downtime causes by total minutes lost. This is the single most useful chart in downtime tracking because it tells you where to focus.
- Timeline view. A horizontal strip per machine showing run, stop, and idle blocks across the shift, which makes patterns and clusters jump out.
- Trend by week and month. Shows whether your improvements are actually working.
For tools that help you present this information, explore visualization tools built for real-time plant data.
Suggested in-article image: downtime Pareto chart next to a live line status board.
Step 8: Add Alerts and Escalation
Tracking after the fact is valuable, but responding while the machine is still down is better. Add notifications so the right person hears about a stop quickly:
- Notify the line lead when a stop exceeds a short threshold.
- Escalate to maintenance or a supervisor if the stop lasts longer than a second threshold.
- Send mobile or email notifications for critical assets and after-hours events.
- Use different alert paths for different downtime categories so electricians are not paged for material shortages.
Be careful not to flood people. Alerts that fire constantly get ignored, which is worse than having no alerts. Start with a few high-value rules and tune them. A purpose-built alarm logging and notification tool can handle routing, acknowledgment, and escalation so nothing depends on someone happening to look at a screen.
Step 9: Calculate the Metrics That Matter
Once events are flowing, the numbers practically calculate themselves.
- Availability. Run time divided by planned production time. This is the downtime component of OEE.
- Total downtime and stop count per machine, shift, and day.
- MTBF (mean time between failures). How long the machine typically runs between unplanned stops.
- MTTR (mean time to repair). How long a typical stop lasts from start to recovery.
- Top losses. The few reasons that account for most lost minutes.
MTBF and MTTR together tell you different stories. A machine with a low MTBF fails often and may need a reliability fix. A machine with a high MTTR fails less often but takes too long to recover and may need better spares, procedures, or training. Automatic tracking makes both numbers trustworthy for the first time.
Step 10: Close the Loop with Action
The most common failure in downtime programs is not technical. It is that nobody acts on the data. Build the habit into your routine:
- Review the previous day's top three losses in a short daily meeting at the line.
- Assign each recurring cause to an owner and a due date.
- Check the Pareto again a few weeks later to confirm the loss actually went down.
- Share wins with operators so they see that the system produces results, not just extra scrutiny.
When operators see that a reason they selected led to a fix, accuracy of reason capture improves on its own.
Common Mistakes to Avoid
- Starting too big. Instrumenting every machine at once creates a project nobody finishes. Start with one line and prove value.
- Trusting a single signal. A stuck status bit can hide hours of real downtime. Cross-check with counters.
- Overcomplicated reason codes. Long lists lead to "other" becoming the biggest category.
- Ignoring planned downtime. Without tagging planned stops, your unplanned numbers look inflated and credibility suffers.
- Using the data to blame. If operators think downtime tracking is surveillance, they will game it. Position it as a tool to remove obstacles from their work.
- Skipping validation. Always compare automated results with a manual observation for a few shifts before rolling out wide.
- No owner. Someone must be responsible for the reason list, the rules, and the review meeting.
A 30-60-90 Day Rollout Plan
Days 1 to 30: Prove it on one line. Pick the constraint line, agree on definitions, connect the key signals, and build state detection. Run it alongside your manual method and compare.
Days 31 to 60: Add reasons and visibility. Introduce the short reason list, put a live status board on the floor, and start the daily review of top losses.
Days 61 to 90: Expand and automate response. Add alerts and escalation, extend to the next lines, and start reporting availability, MTBF, and MTTR to leadership.
By the end of the first quarter you should have trustworthy downtime numbers on your most important equipment and a repeatable pattern for rolling it out everywhere else.
Industrial Data Collection and Real-Time Monitoring
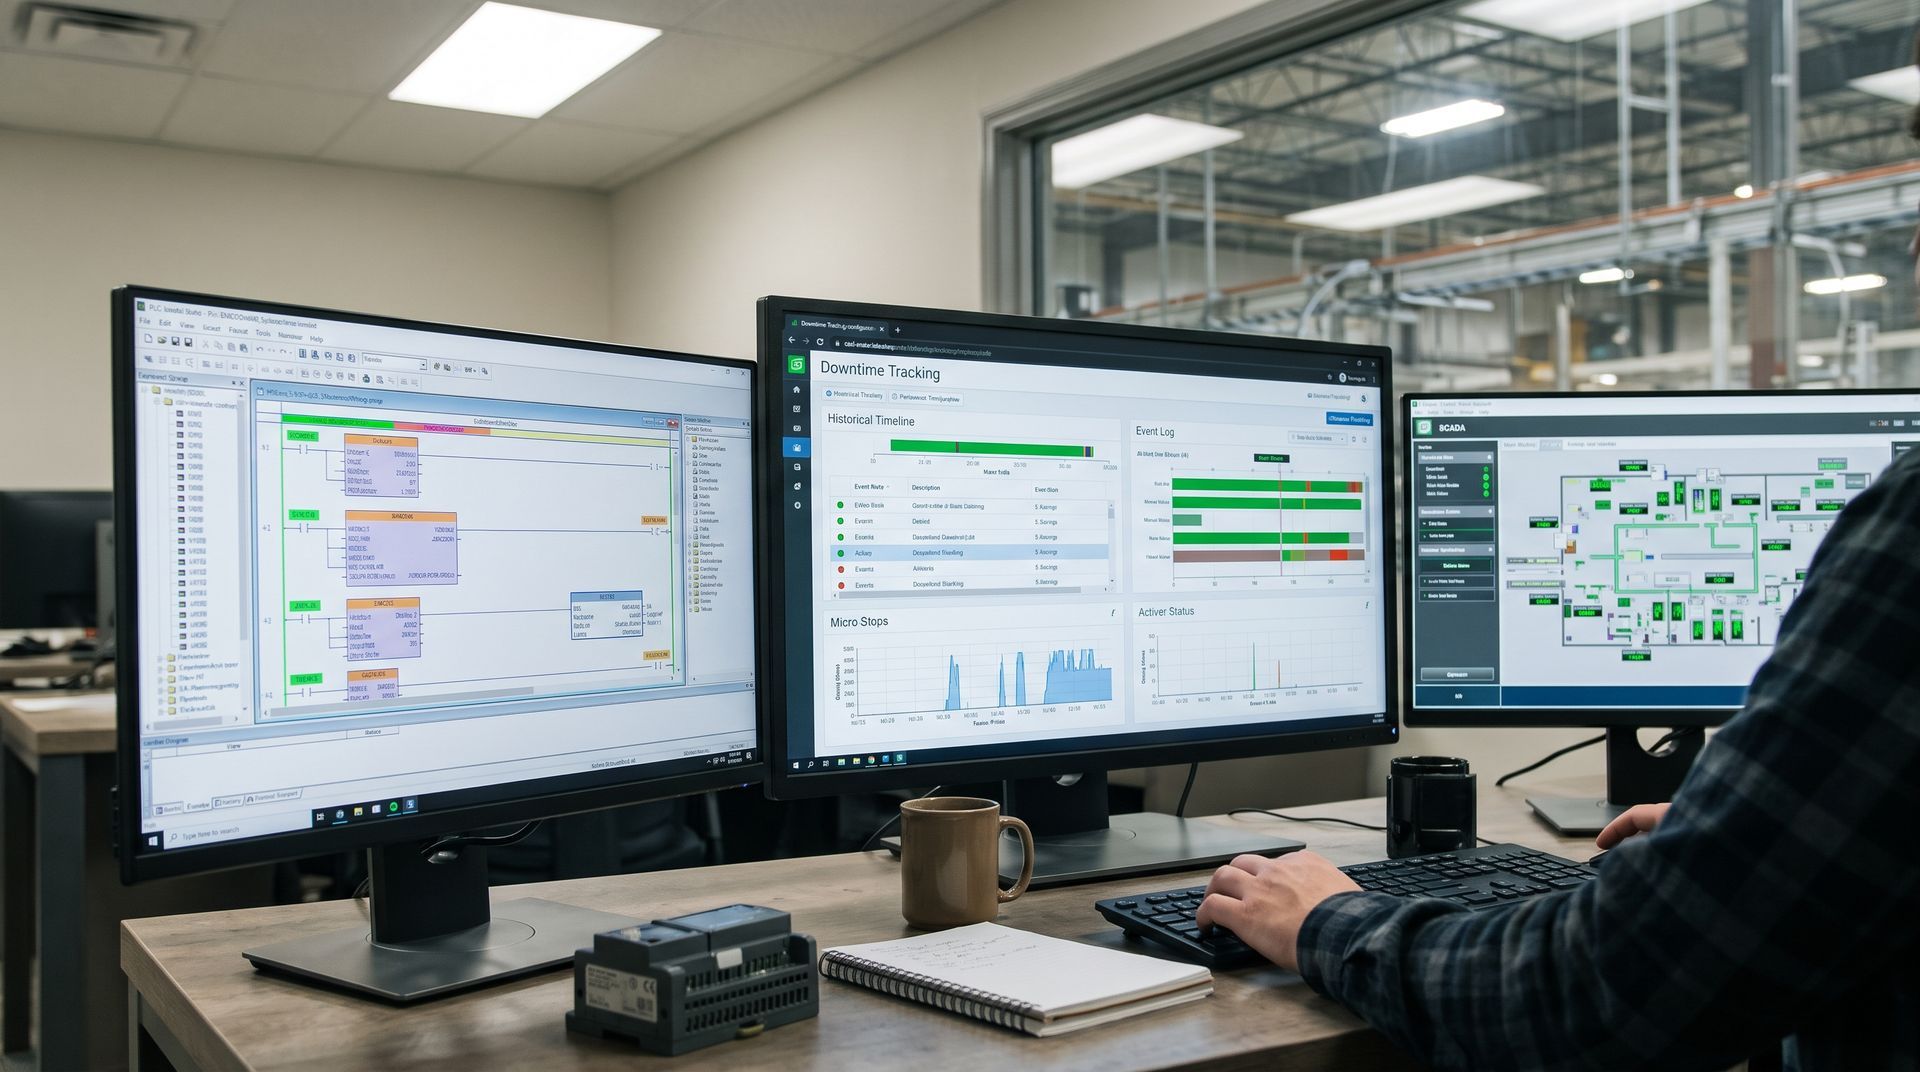
Automatic downtime tracking depends on reliable industrial data collection. Real-time monitoring of machine status, production counts, and fault codes gives you a continuous view of equipment performance instead of a snapshot at the end of the shift. Data acquisition from PLCs, SCADA systems, and IoT devices feeds the same platform, so manufacturing operations get one consistent source of truth for machine downtime, cycle time, and production efficiency.
OEE, Predictive Maintenance, and Continuous Improvement
Overall equipment effectiveness is built on availability, performance, and quality, and availability starts with accurate downtime data. Once you trust that data, you can move beyond reacting to stops and start using trends for predictive maintenance, spotting the machines whose stop frequency is creeping upward before they fail. These insights support lean manufacturing, root cause analysis, and a culture of continuous improvement across the plant.
How do you track downtime automatically without replacing equipment?
Read signals the machine already produces, such as a run bit, part counter, stack light, or fault code, through a data connector or small I/O gateway. Apply simple rules that turn those signals into start and end times for each stop, store the events in a historian, and let operators add a reason with a quick selection. No machine replacement is required.
Frequently Asked Questions About Tracking Downtime Automatically
1. What is the easiest way to start tracking downtime automatically?
Start with one critical machine or line and read a simple run status and part counter. Even a stack light signal can drive useful tracking. Prove accuracy on that line before expanding.
2. Do I need to replace my PLCs or older machines?
Usually not. Most controllers can be read through standard protocols, and machines without a network can be monitored with a small I/O module that watches a relay, light, or sensor.
3. How do I stop false downtime events from flickering signals?
Use a minimum duration threshold and a short confirmation time before ending an event. Combine the status signal with a counter so a single noisy tag cannot create or hide downtime.
4. How do operators enter reasons without slowing production?
Prompt them with a short, hierarchical list on a touchscreen or HMI when a stop is detected, and let fault codes assign reasons automatically wherever possible. Keep the first screen to about ten choices.
5. What should I do with micro-stops?
Count them separately from longer stops. Individual micro-stops are small, but together they often represent a large hidden loss, so track total count and total time even if you do not ask for a reason on each one.
6. How soon will I see results?
Accurate time data shows up immediately. Meaningful reductions typically follow once the team starts reviewing the top losses regularly and fixing the repeat causes the data reveals.
Start Tracking Downtime Automatically with Empowered Automation Solutions
If your downtime numbers still come from clipboards and memory, you are making decisions with partial information. Empowered Automation Solutions builds industrial data software that connects to your PLCs, CNC controls, and plant-floor devices, stores everything in a high-performance historian, and puts live status, alarms, and downtime reporting in front of the people who need them. Our engineers understand controls, so we can help you pick the right signals, connect older equipment, and design reason codes your operators will actually use.
Whether you are tracking your first line or standardizing across multiple sites, start with a conversation. Take advantage of our free connectivity assessment to see what your existing equipment can already tell you, or explore our data connector and HMI SCADA tools to see how it all fits together. Your machines already know when they are down. Let's make sure you do too.
You might also like