Downtime Data: What to Capture
Downtime Data: What to Capture
Most plants that start tracking downtime make the same discovery a few months in: they have plenty of data and still cannot answer the questions that matter. Which cause costs us the most? Did the fix we made in March actually work? Why is Line 3 worse on nights? The problem is rarely too little data. It is that the data was captured without a plan, with missing context, inconsistent labels, or fields nobody can interpret.
What you capture at the moment of a stop decides what you can learn later. Record too little and you cannot find root causes. Record too much and operators drown in forms while analysts drown in noise. This guide lays out exactly what downtime data is worth capturing, how to structure it, what to leave out, and how to keep the data clean enough to trust. It is written for plant, maintenance, and operations teams who want downtime data that leads to decisions instead of reports nobody reads.
Start with the Questions You Want to Answer
Good data design works backward from decisions. Before choosing fields, write down the questions you want downtime data to answer. For example:
- Where are we losing the most production time, and how much of it is avoidable?
- Which machines, products, or shifts have the highest stop frequency?
- Are our long stops caused by slow response, slow repair, or waiting on parts?
- Which changeovers take longer than they should?
- Are the same failures repeating after we repair them?
- How much does downtime cost us in lost output?
Each question implies certain data. A question about shifts requires a shift field. A question about repair speed requires response and repair timestamps. A question about repeat failures requires consistent cause labels. If a field does not help answer a question you care about, think twice before collecting it.
The Core Record: Every Downtime Event Needs These
At the heart of downtime data is the event record. Every stop should capture a minimum set of fields, ideally automatically.
- Event ID. A unique identifier so the record can be referenced, corrected, or linked to a work order.
- Asset. The machine, line, cell, or station that stopped, using a consistent naming standard.
- Start time. The exact timestamp when the stop began, to the second.
- End time. The exact timestamp when the machine returned to production.
- Duration. Calculated from start and end, not typed in.
- State. What kind of stop it was: faulted, idle, blocked, starved, planned stop, changeover, or similar.
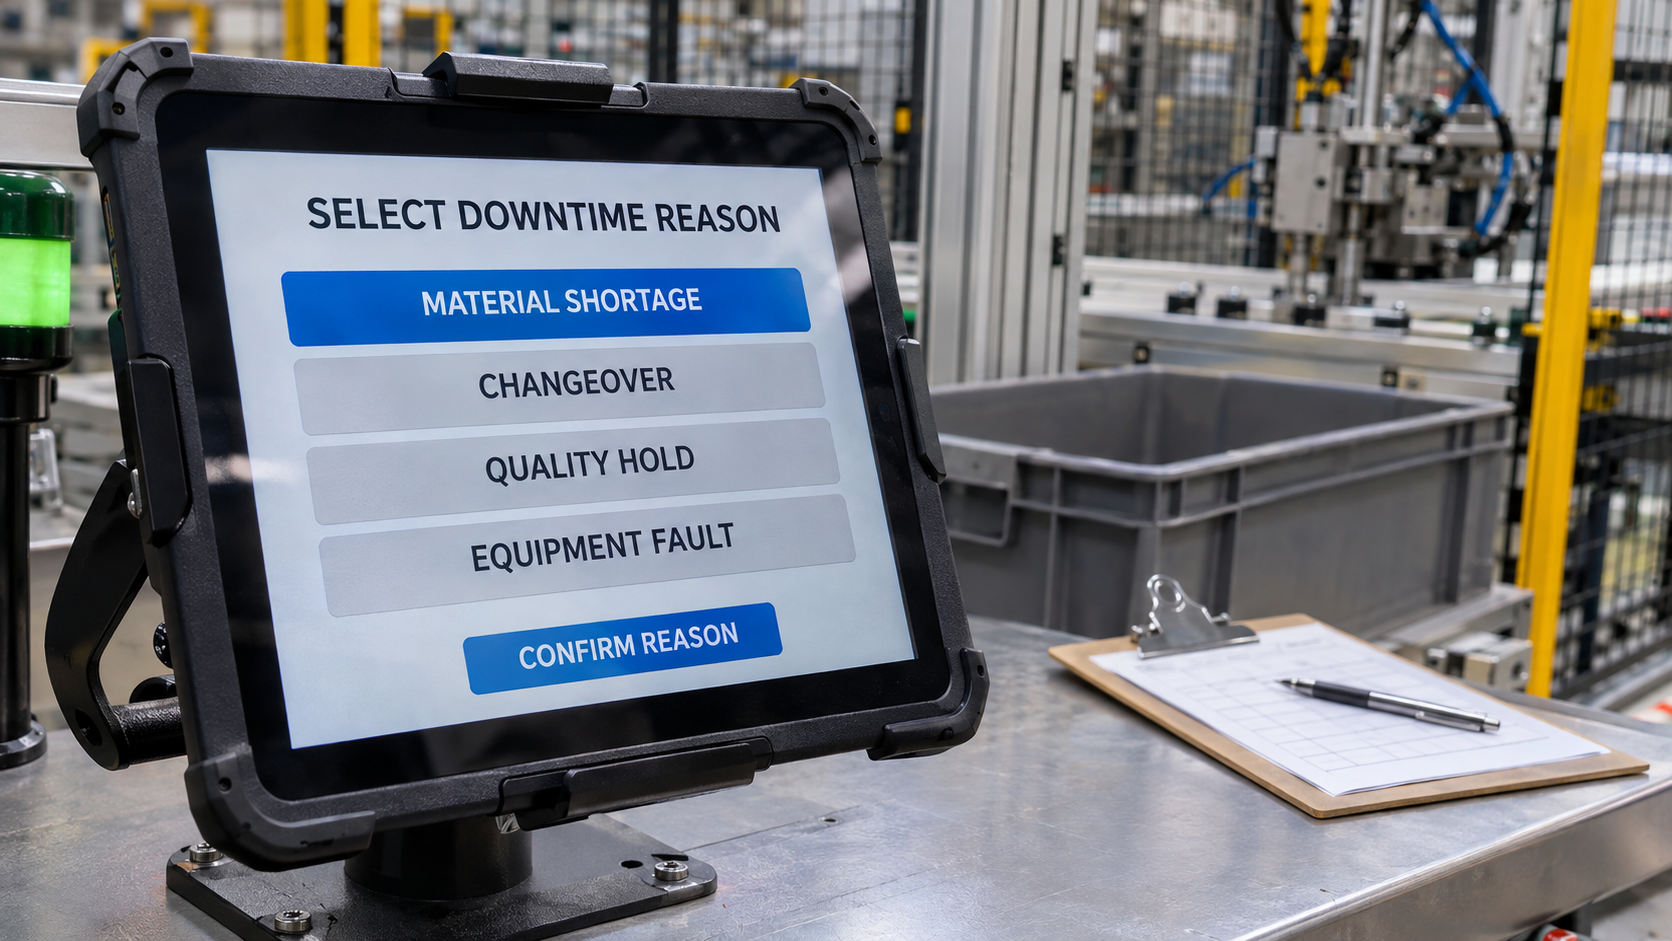
- Reason code. Why it stopped, selected from a controlled list or assigned from a fault code.
- Source of the reason. Whether the reason was assigned automatically or chosen by a person, which helps you judge data quality.
Capturing start and end times automatically, rather than asking people to type them, is the single biggest step toward trustworthy data. Everything else builds on accurate timestamps.
Planned vs Unplanned Downtime
Every event should be tagged as planned or unplanned. Mixing them hides the opportunity and distorts your metrics.
- Planned downtime includes scheduled maintenance, breaks, meetings, training, and scheduled changeovers. These are real time not producing, but they are expected and managed.
- Unplanned downtime includes breakdowns, jams, material shortages, quality holds, and unexpected waits. This is the main target for reduction.
Some plants treat changeovers as a separate category because they are planned in occurrence but often improvable in duration. Whatever you choose, document the rule. Reports that blend planned and unplanned time give leaders the wrong impression of where the problem lies.
Reason Codes: The Heart of Useful Analysis
Time tells you how much was lost. Reasons tell you why. A well-designed reason code list is what turns a log into a ranking of problems worth solving.
Keep it hierarchical and short. Use around eight to ten top-level categories, with optional second-level detail. For example:
- Mechanical: bearing, belt or chain, jam, tooling wear, lubrication
- Electrical and controls: sensor fault, drive fault, PLC fault, communication loss
- Material: out of material, wrong material, material quality, delayed delivery
- Changeover and setup: product changeover, tooling change, first-article approval
- Quality: out-of-spec product, inspection hold, rework
- Operator and staffing: no operator, training, break coverage
- Utilities and facilities: air, power, water, temperature
- Upstream and downstream: starved, blocked
- Planned maintenance and cleaning
- Other (to be reviewed)
Make codes mutually exclusive and clearly defined. If two codes could describe the same event, operators will split between them and your ranking will blur.
Watch the "other" bucket. If it becomes one of the top categories, your list is missing something or operators are avoiding the effort of choosing. Review those entries monthly and add codes where patterns appear.
Describe cause, not blame. Codes like "operator error" invite defensiveness. "Setup incorrect" or "training gap" point to something fixable.
Capturing Micro-Stops
Short stops deserve a plan of their own. Individually trivial, together they often represent a huge hidden loss.
- Set a threshold. Decide the duration below which a stop is a micro-stop, commonly in the range of 30 seconds to a couple of minutes.
- Count them, do not interrogate them. Do not ask operators for a reason on every micro-stop. Capture count, total time, and the asset, and let fault codes explain what they can.
- Track micro-stop rate. Stops per hour or per thousand units reveals machines that are "nibbling" away capacity.
- Look for patterns. Clusters at certain times, after changeovers, or with specific products point to root causes.
- When you automate data collection, micro-stops are recorded without any extra effort, which is one of the strongest arguments for automation over manual logs.
Production Context: Product, Order, and Shift
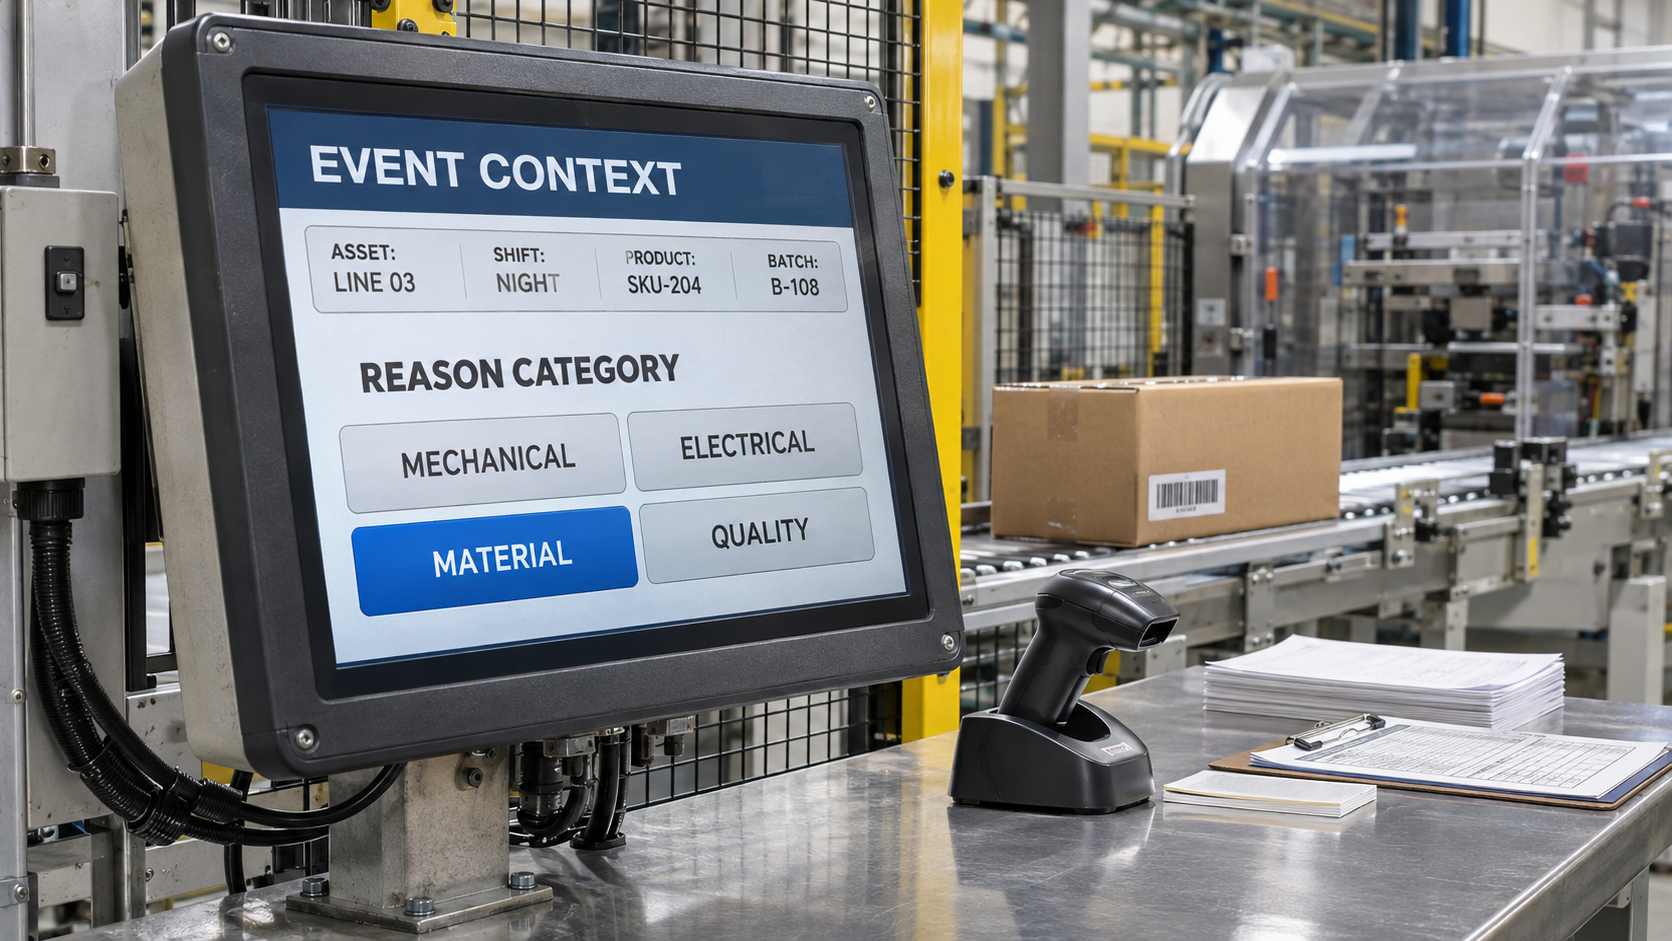
A stop is far more useful when you know what was happening around it. Capture context fields alongside each event.
- Shift and crew. Allows comparison of stop patterns across shifts and teams, which often reveals training or handoff issues.
- Product or SKU. Some products run harder than others. Without this field you will blame the machine for what is really a material or recipe effect.
- Work order or production order. Links downtime to jobs, which supports cost allocation and customer reporting.
- Lot or batch. Helps trace quality-related stops to material sources.
- Planned production time. Needed to calculate availability correctly.
Most of this context already exists in your MES, ERP, or scheduling system. The goal is to connect it to the event automatically instead of asking operators to retype it.
Machine Signals and Fault Codes
The machine itself often knows why it stopped. Capture that information at the time of the event.
- Fault and alarm codes. The active alarm at the moment of the stop, with its text description. These often assign the reason automatically.
- Machine mode. Auto, manual, setup, E-stop, or maintenance mode, which separates real faults from deliberate actions.
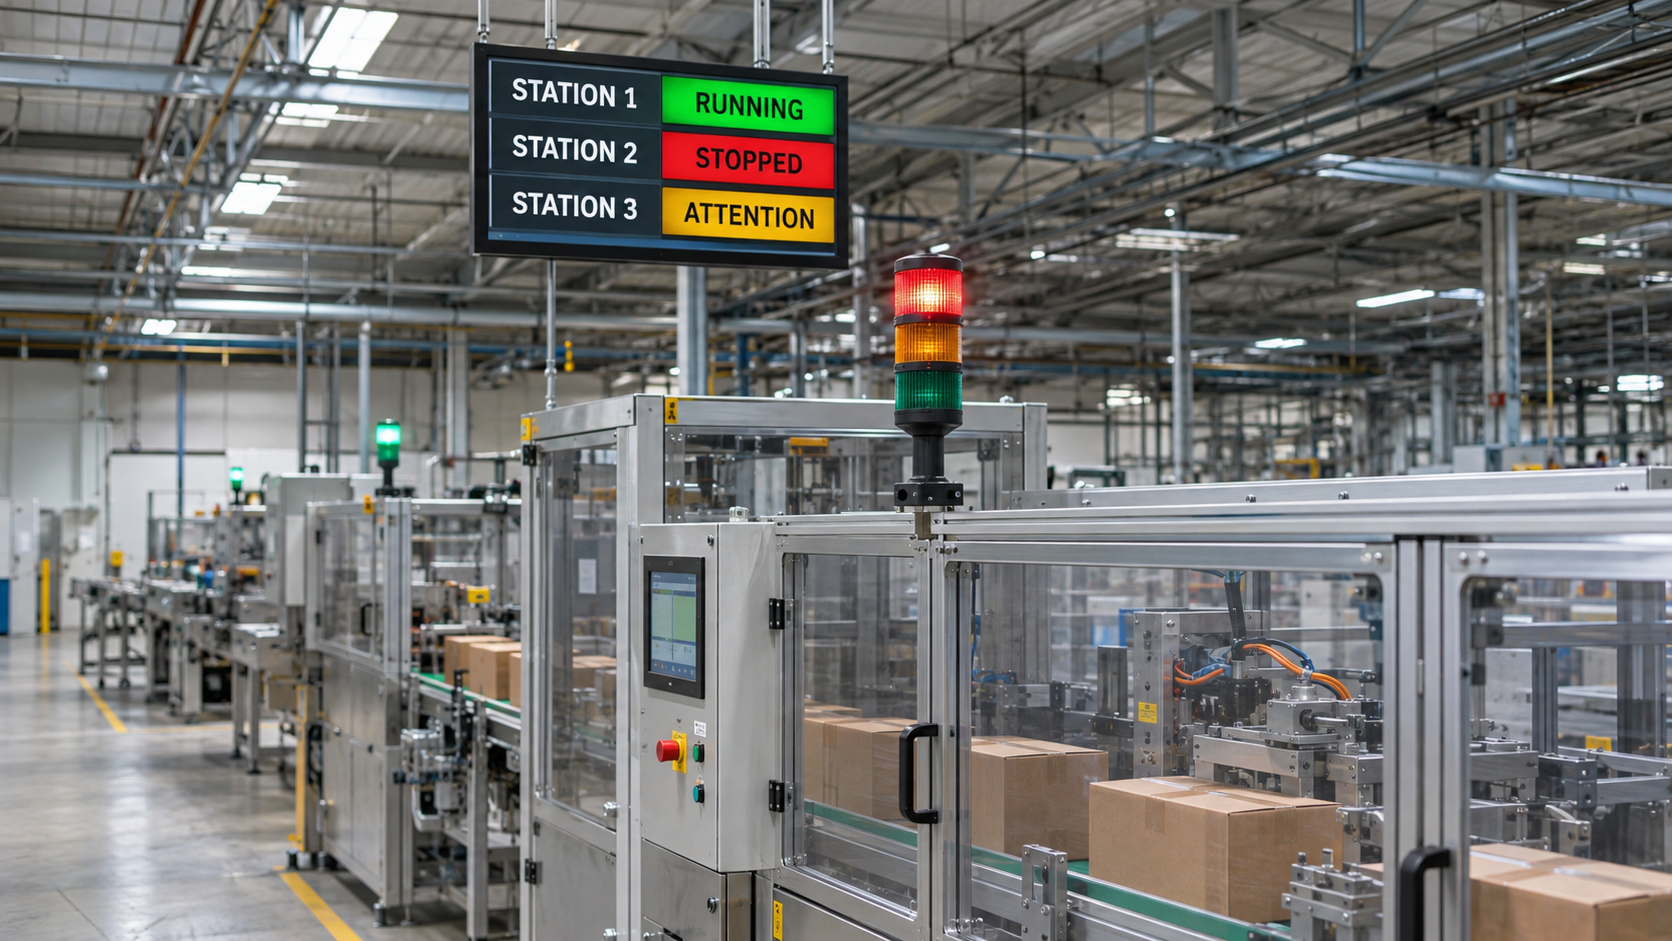
- Stack light or status state. Useful where deeper signals are unavailable.
- Last cycle information. Cycle count and time of the last good cycle help confirm when production actually stopped.
- Upstream and downstream status. Whether neighbors were blocked or starved, which distinguishes a local problem from a line problem.
Storing these signals in a data historian alongside the event lets you examine the process values leading up to the stop without capturing every value in the event record itself.
Process Values Around the Event
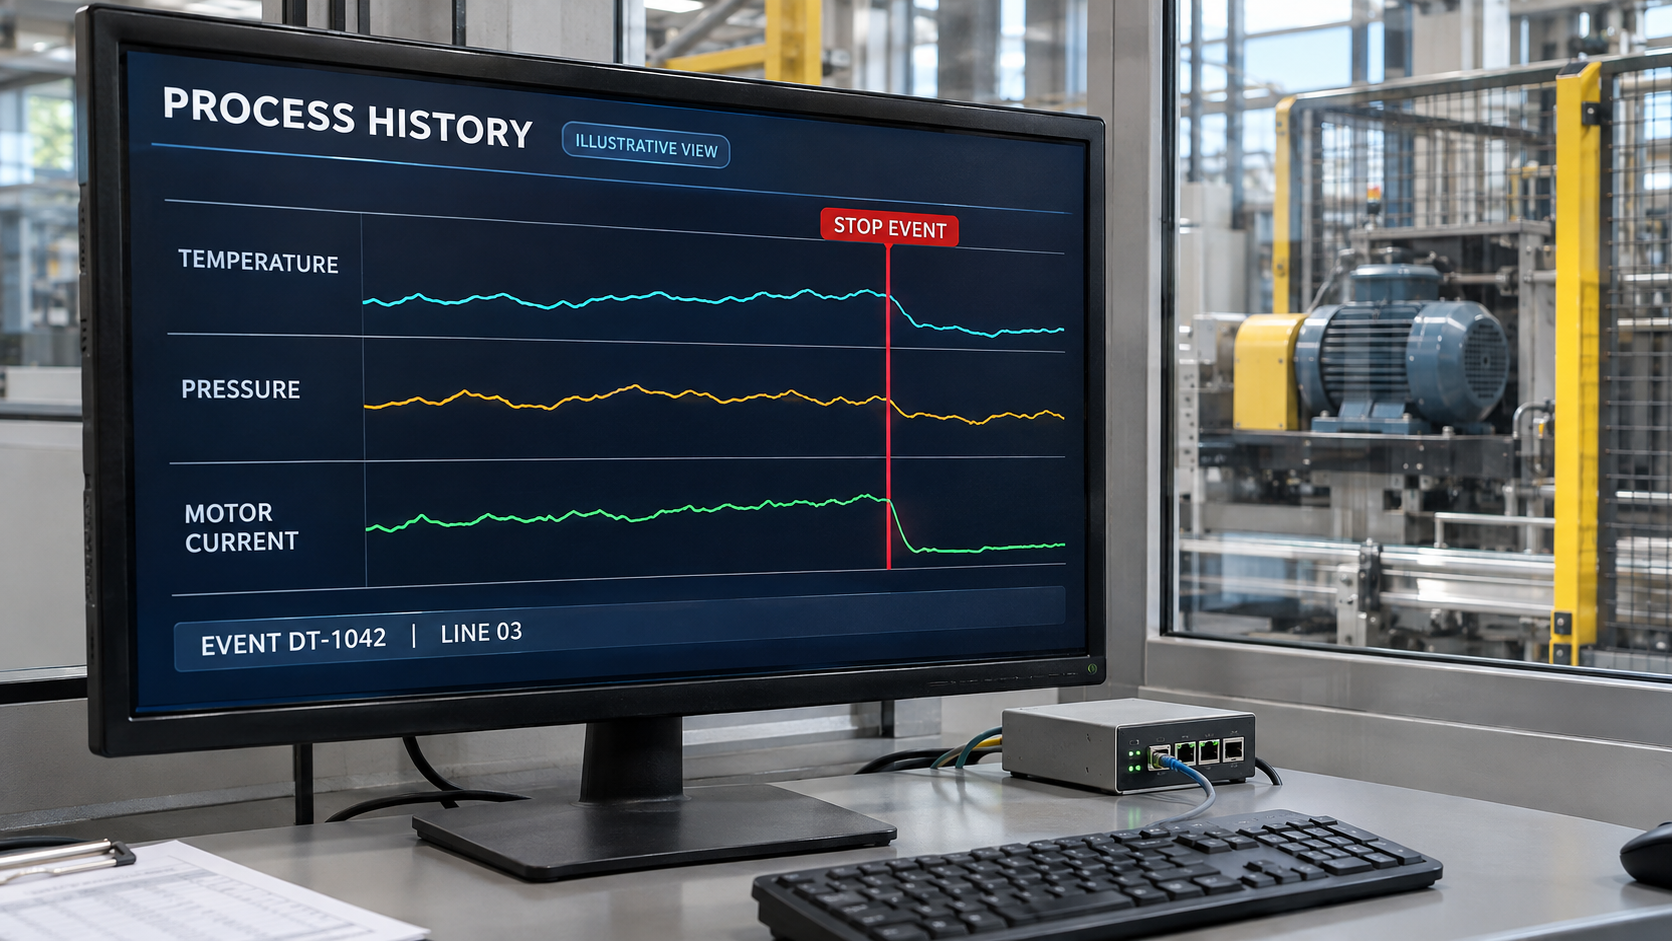
For root cause analysis, a few seconds or minutes of process data before and after a stop can be gold. You do not need to copy these values into every downtime record, but you do need to keep them retrievable.
- Temperatures, pressures, speeds, and motor currents leading up to the stop.
- Setpoint changes or recipe changes shortly before the event.
- Vibration or other condition monitoring signals, where available.
- Environmental conditions if they affect the process.
The approach is simple: store high-quality, time-stamped tag data in the historian, and link each downtime event to its time window. When an investigator wants to know what changed, the answer is one query away.
Suggested in-article image: trend chart showing process values leading up to a stop event.
Response, Repair, and Maintenance Data
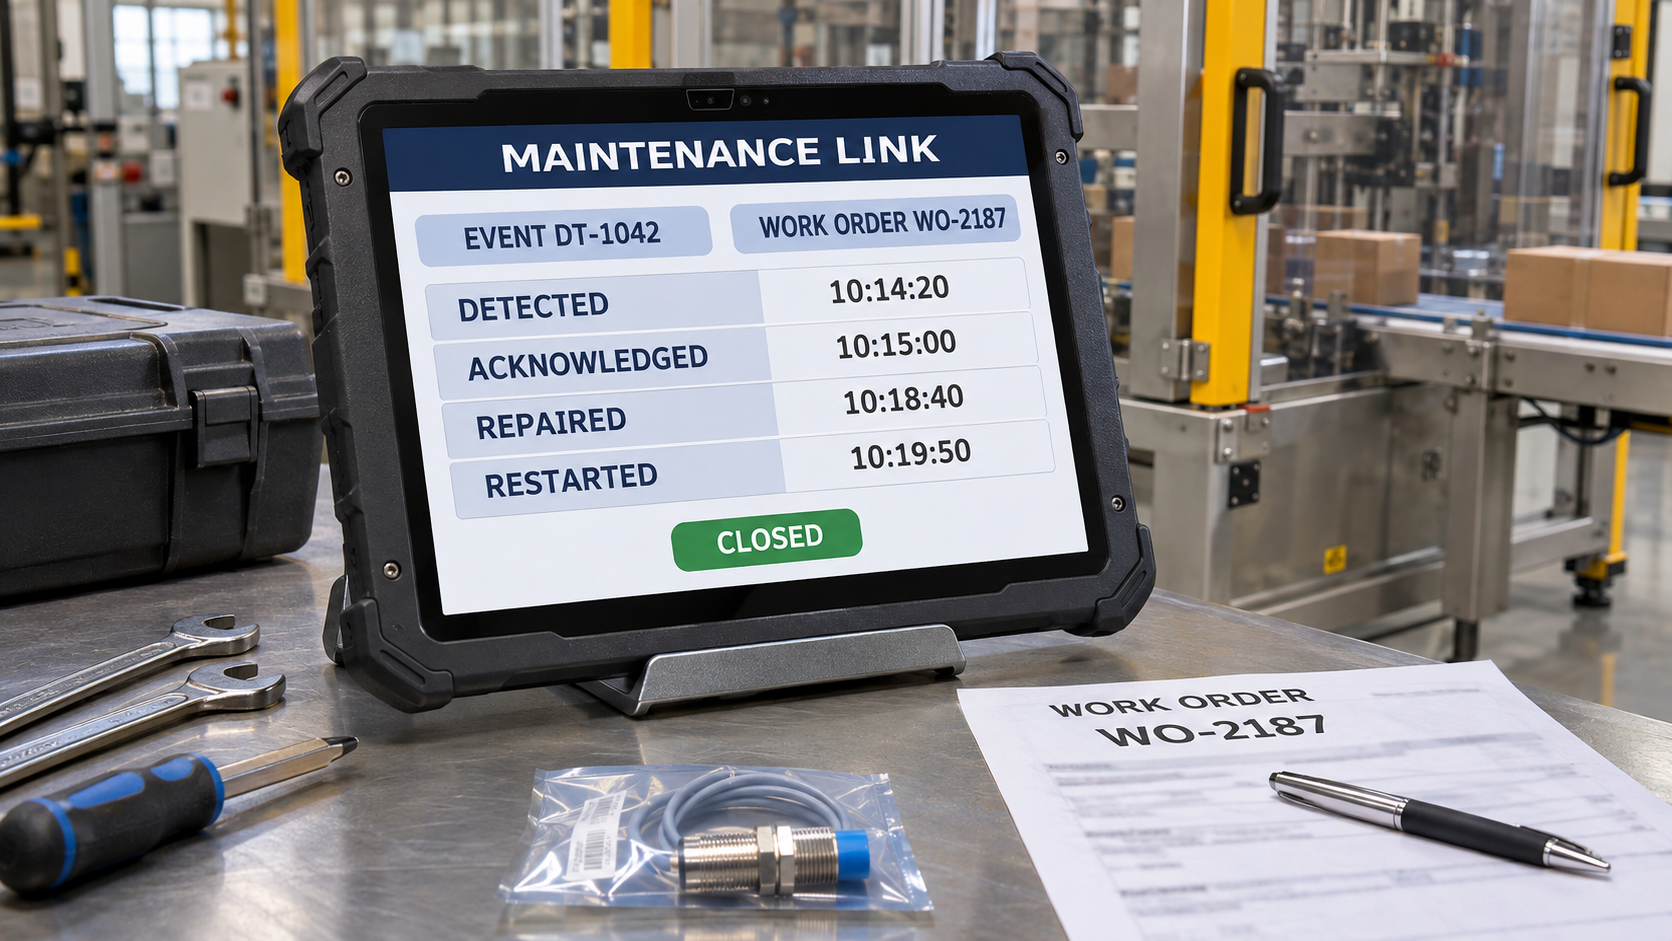
Total downtime hides an important distinction: how long did it take to respond, and how long did it take to fix? Capturing a few additional timestamps separates the two.
- Time called or detected. When the stop was recognized or raised.
- Time acknowledged. When a technician or lead accepted responsibility.
- Time arrived. When help was on site, where relevant.
- Time repaired and time restarted. The difference between these shows startup and verification time.
- Work order number. Links the event to maintenance records, parts used, labor hours, and the final root cause.
- Failure code and corrective action. What failed and what was done, using standard maintenance vocabulary.
These fields let you calculate MTTR and response time separately, and they connect production downtime to maintenance history so you can see whether repairs hold. A good alarm logging and notification system can capture acknowledgment and response timestamps automatically.
Production Counts and Loss Context
Downtime is one of several losses. To see its true weight, capture the counts that let you compare it with the others.
- Good count, reject count, and total count over the shift or order.
- Ideal or standard cycle time for the product.
- Actual speed or rate, to expose slow running that never shows up as a stop.
- Scrap and rework quantities with reasons.
Together with downtime, these let you compute OEE and put availability, performance, and quality side by side. Often the biggest opportunity is not where people expect, and capturing all three keeps you from optimizing one loss while ignoring a larger one.
Operator Comments and Notes
Structured data answers most questions. Free text answers the rest. Allow an optional comment field on each event, and encourage it for unusual or long stops.
- Make it optional so it does not slow the common case.
- Prompt for it automatically on very long stops or "other" reasons.
- Review comments in the daily meeting, since they often contain the clues the codes miss.
- Mine recurring words and phrases to add new reason codes over time.
- Comments are a feedback loop on your reason list. If the same note appears repeatedly, it deserves a code.
Data Quality: Keeping the Data Trustworthy
Data captured poorly is worse than no data, because it earns confidence it does not deserve. Build quality in from the start.
- Synchronize clocks. PLCs, servers, and handheld devices should share a time source. Mismatched clocks make events impossible to correlate.
- Use consistent naming. Standardize asset names, line names, and tag naming conventions across the plant. "Line 4," "L4," and "Line IV" should not coexist.
- Control the lists. Reason codes, products, and shift definitions should come from controlled lists, not free text.
- Handle unassigned events. Flag events with no reason and review them promptly instead of letting them pile up.
- Allow corrections with an audit trail. People will make mistakes, so provide a way to fix a reason while recording who changed what and when.
- Validate automatically. Reject impossible entries, such as an end time before a start time or an overlapping event on the same asset.
- Audit periodically. Compare automated results with a short manual observation to confirm the logic still reflects reality.
What Not to Capture
More fields do not mean better data. Every extra field costs attention and creates opportunities for inconsistency.
- Fields nobody will analyze or act on.
- Information that is already available elsewhere and can be joined automatically, such as product descriptions or order quantities.
- Overly granular reason codes that operators cannot distinguish in the moment.
- Personal identifiers beyond what you need for training and accountability, since blame-oriented data discourages honest reporting.
- Free-text fields that replace what a controlled list could do better.
A useful test: for each field, name the report, decision, or action it supports. If you cannot, leave it out and revisit later.
A Simple Downtime Event Data Model
Here is a practical starting point you can adapt. Each downtime event includes:
Identity and time: event ID, asset, start time, end time, duration.
Classification: planned or unplanned, state, primary reason, secondary reason, reason source (automatic or operator).
Machine context: fault code, machine mode, last good cycle time.
Production context: shift, crew, product, work order, lot, planned production time.
Response and repair: time detected, time acknowledged, time repaired, work order number, corrective action.
Notes: optional operator comment.
This set covers the questions most plants need to answer and can be built from a mix of automated signals, system integrations, and brief operator input. Start here and add fields only when a specific question demands them.
Metrics You Can Calculate from Good Downtime Data
With the right fields captured, a rich set of measures becomes available.
- Availability and OEE by machine, line, shift, and product.
- Pareto of reasons by total time and by frequency.
- MTBF and MTTR to separate reliability problems from repair-speed problems.
- Response time and its trend by shift and call type.
- Micro-stop rate per hour or per thousand units.
- Planned versus unplanned ratio over time.
- Repeat failure rate for the same asset and cause.
- Cost of downtime using your own value of lost output per minute at the constraint.
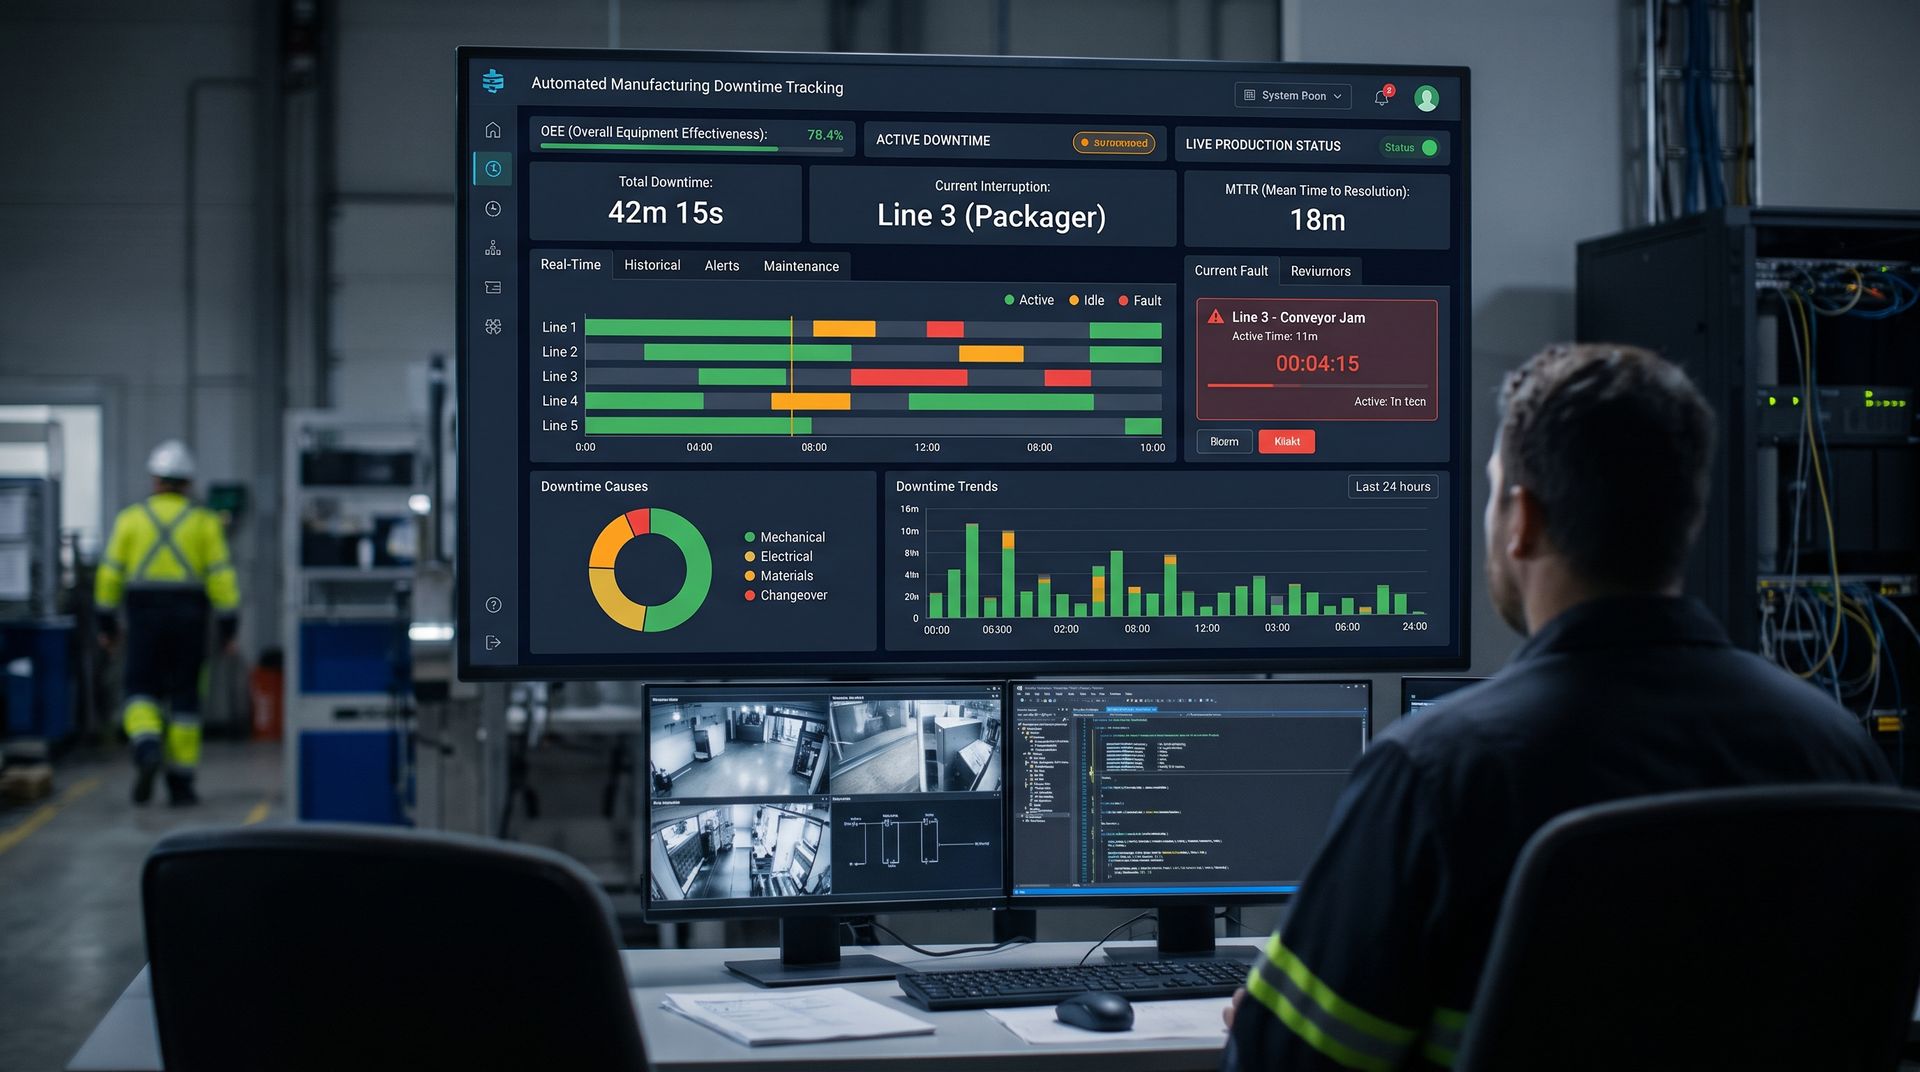
Displaying these on live dashboards using
visualization tools keeps the information in front of the people who can act on it.
Retention and Storage
Downtime and process data are most valuable with history. Plan how long to keep it and where.
- Keep raw event records for years, since seasonal and long-term patterns need them.
- Keep high-resolution process tag data for a shorter period, then archive or aggregate older data.
- Back up the historian and event data and test restores.
- Document your definitions and reason code history, so trends remain interpretable after the list changes.
Time-series data is exactly what a historian is built for, which makes it a natural home for both the events and the signals that explain them.
Industrial Data Collection for Downtime Analysis
- Effective downtime analysis depends on reliable industrial data collection. Data acquisition from PLCs, SCADA systems, and IoT devices provides the machine status, production counts, fault codes, and cycle times that make downtime events meaningful. When this information is captured consistently and stored with accurate timestamps, manufacturing teams can support OEE tracking, predictive maintenance, root cause analysis, and continuous improvement with confidence.
What downtime data should you capture first?
- Capture, automatically, the asset, exact start and end times, state, and reason, with planned or unplanned tagged. Add shift, product, and fault code next. These fields alone support a reliable Pareto of top losses, and you can layer in response times and maintenance links later.
Downtime Data: What to Capture: A Quick Review
Use this review to check your data design.
- Capture asset, start, end, state, planned or unplanned, and a controlled reason code on every stop.
- Add production context and fault codes automatically, keep process data in a historian, and leave out fields nobody uses.
Frequently Asked Questions About Downtime Data
1. What is the minimum data I need for every downtime event?
Asset, exact start and end times, state, planned or unplanned classification, and a reason code. Capture timestamps automatically so durations are accurate and consistent.
2. How many reason codes should I use?
About eight to ten top-level categories, with optional second-level detail. Longer lists slow operators and cause inconsistent selection, which weakens your analysis.
3. Should I record every micro-stop?
Count and time them, but do not require a reason on each one. Track total count and rate, and use fault codes to explain what you can. Patterns in micro-stops often point to root causes.
4. How do I link downtime to maintenance records?
Include a work order number on the event and capture response and repair timestamps. This connects production losses to parts, labor, and corrective actions in your maintenance system.
5. How do I keep operators from picking the wrong reason?
Keep the list short and clearly defined, prompt at the moment of the stop, let fault codes assign reasons where possible, and review unassigned or "other" events regularly with the team.
6. Why does time synchronization matter?
If PLCs, servers, and devices disagree on the time, events cannot be correlated accurately across systems. A shared time source keeps start times, alarms, and process data aligned.
Build a Downtime Data Foundation with Empowered Automation Solutions
The difference between a downtime report and a downtime improvement program is usually the data behind it. Empowered Automation Solutions provides industrial data software that connects to your PLCs, CNC controls, and plant-floor devices, timestamps every stop automatically, stores events and process values in a high-performance historian, and presents them in dashboards your team can act on. Our engineers speak controls, so we can help you choose the right fields, design reason codes that fit your operation, and connect the context that makes each stop meaningful.
Whether you are defining your first downtime data model or cleaning up one that has grown unwieldy, start with a conversation. Take advantage of our free connectivity assessment to see what your equipment can already report, or explore our data connector and HMI SCADA tools to see how it all comes together. Capture the right data once, and every future decision gets easier.
You might also like