
OEE (Overall Equipment Effectiveness or Total Equipment Effectiveness)
OEE (Overall Equipment Effectiveness) Explained
In definition, the OEE is an indicator that measures the efficiency of industrial machinery and is positioned as a key tool for the philosophy of continuous improvement in a company.
For companies, there has always been the need to be able to quantify the productivity and efficiency of production processes, which is why this indicator was born with the ability to indicate, using a percentage, the real effectiveness of any production process. It is a relentless tool when it comes to detecting inefficiencies that originate during a production process. Let us bear in mind that what is measured can be managed and improved.
Certainly deciding to measure OEE in your production plant is an indication that you are on the road to increasing production.
To measure the OEE in your plant there are 3 ways; Manual, traditional automatic, and modern automatic.
Manual Capture
To measure OEE manually, you must make a format and use it on each machine to be tested. The important data in the format are:
- Production Order
- Machine Setup
- Production Time
- Units Produced
- Amount of Waste
- Stops (Time)
These data must be measured for each shift that the machine is running and times must be entered each time they occur (never at the end of the shift) with a clock in hand.
Then at the same time every day, a team in charge of entering the data in Excel (or another platform for this), will deliver data to the production analyst and he will generate a daily production report. Then a monitoring committee must check that the information is up-to-date and up-to-date.
A team of digitizers will be in charge of collecting these forms always at the same time and entering them into an Excel format to deliver them to the production analyst who will generate a daily production report. Then, you should organize a monitoring committee that, in no more than 5 minutes, checks that the information is up-to-date and up-to-date.
With the data in this report, you will apply the OEE formula:
Availability x Performance x Quality = OEE
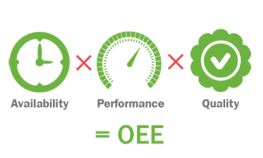
Availability: Is the percentage of the time that the machine was operational. For example, if in an 8-hour shift, the machine was producing 6 functional hours, it will have an Availability of 75%.
Yield: These are the units produced compared to the cruising speed of the machine. For example, if the equipment has a production capacity of 10 units per minute, but actually produced 8, it will represent a yield of 80%.
Quality: Is the percentage of the total production that is produced without defects. For example, if out of 1000 units produced, 100 do not meet the standards, the Quality will be 90%.
Advantages:
- Raises awareness among operators about its indicators
- It allows implementing Lean Manufacturing tools
- Faster implementation
Disadvantages:
- Long learning curve
- Inaccurate information
- Delayed response time
- Long implementation time
- Information and indicators are not standardized between plants
Traditional Auto-Capture
To measure OEE in a traditional automatic way, some physical adjustments must be made that consist of:
- PLCs for each machine, a different adaptation is needed depending on the technology of each one. It is necessary to configure a software that interprets the information of all the PLCs in a standard
- Server infrastructure where the information is collected (SCADA and HISTORIAN licenses)
- Second level of servers where the information is processed and sent to the control center/(MOM, MES, EDM SYSTEMS)
- Unit where the ERP is located, which will be reviewed by the team in charge of the plants
The data collected with this method is much more complete and has a longer history than the manual method. Key indicators, such as the OEE, will be calculated automatically.
Advantages:
- Shorter learning curve than manual capture
- Accurate information
- Standardized information between plants Disadvantages:
- It requires specialized equipment and infrastructure
- Complex maintenance
- Very high costs in the market
Modern Auto Capture
To measure OEE in a modern automatic way, you must implement a sensor (in most cases independent of the plc you have) in each machine you want to measure, install specialized software where all the sensors will report, and make an initial configuration, consisting of:
- Machine cruising speed
- It is recommended to choose 30 possible causes of machine stoppage
The software will take care of taking the times automatically, of keeping the count of the units produced and the defective units. In addition, it will ask the operator the reason for each stop each time it occurs (he will choose from the 30 recommended that were configured).
Finally, the software will automatically generate the reports and calculate the OEE, making it available to the people involved through screens in the plant and online files.
Advantages:
- It costs less than traditional automatic capture
- Few or no infrastructure equipment
- It is naturally impregnated with good measurement, calculation, and reporting practices
- You can take advantage of the existing infrastructure in the plant
- Industry 4.0 processes
- Easy maintenance Disadvantages:
- Can't remotely control machines
- It does not calculate all the variables of the machines
Thus, we can affirm that the OEE indicator should be an essential tool in all the processes carried out in a plant committed to continuous improvement.
Are there tools or software to help track OEE?
Yes. Plants start with paper forms and spreadsheets, move to PLC, SCADA and historian data, or use sensor-based software that counts units, records stop causes and reports the result. The right choice depends on how many machines you must cover and how quickly you need trusted numbers.
Worked Example: Availability x Performance x Quality
In today's competitive manufacturing landscape, understanding Overall Equipment Effectiveness (OEE) is paramount. As equipment and infrastructure evolve, so do the methods to monitor performance effectively. Complex maintenance can lead to very high costs in the market; thus, leveraging modern auto capture techniques is essential.
To measure OEE automatically and efficiently, implementation of independent sensors for each machine becomes crucial. These sensors contribute data to specialized software that centralizes the information flow. An initial configuration process establishes the machine's cruising speed and identifies up to 30 potential causes for stoppages.
Take an illustrative shift: availability 90 percent, performance 95 percent, and quality 98 percent.
Calculating OEE for this shift involves a straightforward formula:
OEE = Availability x Performance x Quality
In our example:
Availability: 0.90 (or 90%)
Performance: 0.95 (or 95%)
Quality: 0.98 (or 98%)
Plugging in these values gives us:
OEE = 0.90 x 0.95 x 0.98 = 0.8415, or 84.15%.
This 84.15% OEE score indicates that there is room for improvement within the manufacturing process. Although the metrics suggest a high level of performance, it also highlights areas needing attention—specifically in availability and quality. In that calculation, the good count is the number of units that meet quality standards, not everything the machine produced. The availability score and the performance score behind the result come from the same shift, and the total count can be checked against total parts for that shift.
To leverage OEE effectively, continuous analysis and reporting practices must be integrated into daily operations. Establishing a feedback loop with real-time data can help identify bottlenecks swiftly and address downtime causes before they escalate into larger issues.
While current systems may lack remote machine control capabilities, embracing Industry 4.0 processes offers a pathway to enhance operational efficiency.
Manual, Traditional Automatic, and Modern Automatic Capture Compared
In the quest for enhanced efficiency, it's important to recognize the distinctions between manual, traditional automatic, and modern automatic OEE capture methods. Each approach has its merits and challenges, influencing how effectively a manufacturing plant can achieve its goals.
Manual Capture:
This method relies on operators to log performance data manually. While it allows for immediate feedback and operator engagement, it often leads to human error, inconsistent data collection, and time inefficiencies.
Traditional Automatic Capture: This approach leverages basic automation tools, such as simple sensors or PLCs (Programmable Logic Controllers) that collect data at predetermined intervals. While traditional systems reduce the risk of human error, they may not capture real-time data accurately enough to respond proactively to issues. The delay in data availability can hinder immediate corrective actions.
The reliance on manual processes hinders real-time analysis and can obscure the true effectiveness of equipment over time. On the shop floor, that means the numbers are available in real time, not only at the end of the shift.
Tying OEE and Downtime Data Back to Historian Collection
Tying OEE and downtime data is vital for comprehensive analysis and continuous improvement. By integrating OEE data with downtime history, manufacturers can better understand root causes of inefficiencies and identify patterns that lead to production losses.
Six Big Losses Affecting OEE
When it comes to improving Overall Equipment Effectiveness (OEE), understanding the six big losses is crucial. These losses are primarily categorized into equipment failure, setup and adjustment, minor stops, reduced speed, defects, and working time. Each of these areas significantly impacts the overall efficiency of the production process. Equipment failure refers to unplanned downtimes caused by machinery breakdowns which can halt production entirely. Setup and adjustment losses occur during the time taken to prepare machines for production, leading to delays. Minor stops, often overlooked, are brief pauses due to operational hiccups that can accumulate over time. Unplanned stops are the clearest availability loss, and recording the stop time for each one makes the loss visible instead of anecdotal. On a packaging line, minor stops of this kind are easy to dismiss one at a time, yet they add up across a shift.
Reduced speed emphasizes the gap between the maximum potential output and the actual output during production. Defects lead to rework or scrap, wasting valuable resources and time. Lastly, working time refers to the available production time that can be utilized effectively. Together, by identifying and addressing these six losses, companies can drive improvements in their OEE, optimizing their production operations and ensuring continuous enhancement towards efficiency.
Benefits of Implementing OEE
Implementing Overall Equipment Effectiveness (OEE) within a manufacturing environment brings a myriad of benefits that can significantly enhance productivity and operational efficiency. One of the primary advantages is the ability to identify and rectify inefficiencies in the production process, leading to reduced downtime and optimized equipment utilization. By leveraging OEE, companies can develop a culture of awareness among operators regarding key performance indicators, fostering active participation in the improvement process.
This collaborative approach aligns well with the principles of Lean Manufacturing, streamlining processes and minimizing waste. Furthermore, automatic data collection methods associated with OEE implementation provide accurate, real-time insights, allowing for faster decision-making and more responsive production adjustments. The establishment of OEE metrics also facilitates better forecasting and planning, as trends become evident, empowering organizations to enhance their strategic initiatives. Overall, the integration of OEE not only boosts performance metrics but also contributes to a dynamic environment poised for continuous improvement.
Origin and Historical Context of OEE
The origin of Overall Equipment Effectiveness (OEE) can be traced back to the mid-20th century when manufacturers were seeking ways to enhance productivity amid growing competition and technological advancements. The concept was formalized as part of the Toyota Production System in the 1980s, which emphasized continuous improvement and waste reduction. At its core, OEE was developed to provide a tangible and quantifiable method for measuring the efficiency of manufacturing processes. Over the years, it has evolved from a simplistic gauge of machine performance to a multifaceted tool integral to modern manufacturing practices. As the industry transitioned into the era of Industry 4.0, OEE metrics began integrating with sophisticated data analytics systems, allowing organizations not only to monitor performance in real-time but also to predict potential downtime through historical trend analysis. Consequently, understanding the historical context of OEE is vital, as it illustrates the shift from reactive to proactive management strategies that are now foundational in driving operational excellence across manufacturing sectors.
OEE and Continuous Improvement (TPM & Lean Manufacturing)
Integrating Overall Equipment Effectiveness (OEE) with methodologies like Total Productive Maintenance (TPM) and Lean Manufacturing is a significant step toward fostering a culture of continuous improvement within an organization. OEE serves as a foundational metric that allows manufacturers to pinpoint inefficiencies in their processes, creating a data-driven approach to enhancement. When combined with TPM principles, which emphasize empowering all employees to take ownership of equipment maintenance, organizations can significantly reduce downtime and optimize machine availability. Lean Manufacturing complements OEE by focusing on eliminating waste and ensuring value creation throughout the production process. By aligning OEE metrics with Lean initiatives, companies develop targeted strategies to enhance performance and quality, driving sustainable productivity gains. This synergy fosters an environment where continuous improvement is not just an initiative, but a core value, leading to increased operational excellence and responsiveness to market demands. Ultimately, the integration of OEE with TPM and Lean principles equips organizations to systematically address challenges, ensuring that they remain competitive and agile in an ever-evolving manufacturing landscape. Clean downtime data also supports predictive maintenance, so a pattern of unplanned stops can be checked before it becomes a breakdown.
Derived Measures: TEEP, Loading Rate, and Overall Operations Effectiveness
Derived measures such as TEEP (Total Effective Equipment Performance), Loading Rate, and Overall Operations Effectiveness (OOE) further enrich the understanding of equipment utilization and operational efficiency. TEEP expands on the traditional OEE metric by incorporating availability into a broader context—it evaluates not only the efficiency within operating hours but also the potential production time available, factoring in planned downtime and even non-operational hours. This metric allows organizations to grasp the full potential of their assets, highlighting opportunities to maximize throughput and minimize waste.
Meanwhile, Loading Rate is a critical parameter that assesses how well resources are allocated against production capacity, ensuring that the equipment's capability aligns with production demands. By measuring the Loading Rate, manufacturers can identify bottlenecks and make informed decisions about resource allocation to enhance efficiency. OOE, on the other hand, integrates both the OEE and emphasizes the overall performance of manufacturing operations, enabling businesses to evaluate their effectiveness at a more comprehensive level. Together, these derived measures provide a multi-dimensional view of operational performance that supports strategic decision-making and underlines the importance of continuous improvement initiatives within the manufacturing landscape.
Alternative Calculations and OEE Value Ranges
When discussing Alternative Calculations and OEE Value Ranges, it becomes essential to recognize that OEE is not solely defined by a singular formula; rather, it can be tailored through various methods depending on specific operational goals. For instance, some businesses adopt a simplistic approach using just two elements—availability and quality—to derive a basic OEE score. This method can provide quick insights but may neglect performance nuances that are critical for a comprehensive understanding of production capabilities. Furthermore, OEE value ranges can vary significantly based on industry standards and effective benchmarks. A common target for world-class manufacturers is to achieve OEE values of 85% or higher, indicative of optimal efficiency. However, industries with more variances in production processes may define acceptable ranges narrower or broader. Establishing clear benchmarks enables manufacturers to not only evaluate their own performance but also to set realistic and scalable improvement objectives. Effective communication of these value ranges fosters a culture of awareness and accountability among teams, aligning their efforts with the overall mission of continuous enhancement across all levels of the organization. This integrative approach ensures that OEE becomes not just a metric but a strategic tool driving operational excellence.
Industry Standards and Benchmarks for OEE
Establishing industry standards and benchmarks for Overall Equipment Effectiveness (OEE) is crucial for manufacturers aiming to evaluate their performance against recognized metrics. These benchmarks serve as a yardstick, allowing businesses to assess their OEE scores in the context of their specific sector. Common targets indicate that world-class manufacturers typically aim for an OEE of 85% or higher, representing optimal efficiency. However, it's important to understand that OEE benchmarks can vary widely among different industries due to the unique challenges and operational circumstances each faces. For instance, industries with high variability in production processes may have broader acceptable ranges, while those in more standardized environments can maintain tighter thresholds. Adopting these benchmarks not only cultivates a culture of accountability among teams but also facilitates a common language for improvement initiatives. By aligning OEE performance with industry standards, organizations can drive meaningful enhancements while cultivating an environment dedicated to continuous improvement.
Common Issues and Pitfalls in OEE Implementation
When implementing Overall Equipment Effectiveness (OEE), organizations often encounter various common issues and pitfalls that can hinder the successful adoption of this critical metric. One prevalent challenge is the lack of employee buy-in; if operators and management do not understand the value of OEE, the initiative may struggle to gain traction. Additionally, inadequate training can lead to confusion and inconsistencies in data collection, as operators may not fully grasp how to accurately log performance or interpret the results. Furthermore, companies may also fall into the trap of overly complex OEE calculations, causing frustration and disengagement among staff. Another significant pitfall is the failure to integrate OEE data with other operational metrics, which can lead to a fragmented approach that limits insights into overall performance. Finally, without a robust feedback loop in place, organizations may overlook opportunities for continuous improvement, leaving potential efficiencies unclaimed. Awareness of these challenges and a proactive strategy to mitigate them can greatly enhance the effectiveness of OEE implementation, ultimately supporting the broader goal of operational excellence.