Downtime Tracking Software
Downtime Tracking Software
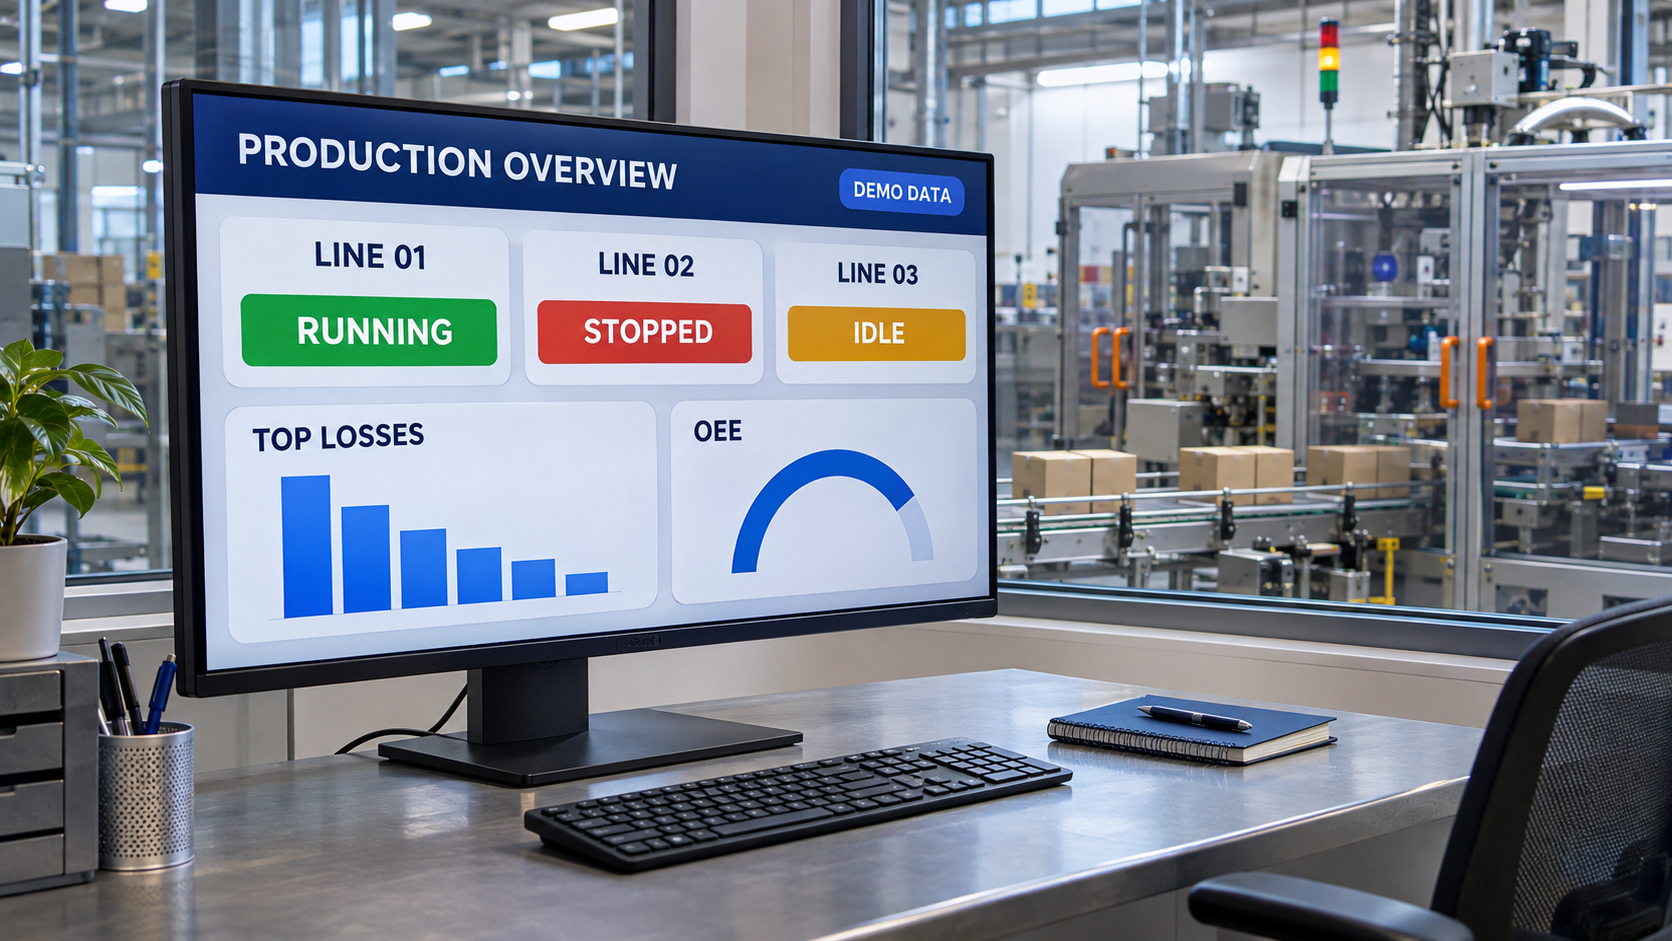
Choosing downtime tracking software looks simple until you start comparing options. One vendor promises instant OEE dashboards. Another offers a mobile app for operators. A third says it connects to everything. Meanwhile your own plant has a mix of modern PLCs, aging controllers, a few machines with no network at all, and a team that already has opinions about every new system. The right choice depends less on feature lists and more on how well the software fits your equipment, your people, and the way you want to improve.
This guide explains what downtime tracking software actually does, the features that matter, how it connects to your machines and other systems, the deployment choices you will face, and the questions to ask before you buy. Whether you are replacing a spreadsheet, upgrading a system your team has outgrown, or evaluating software for the first time, it will help you separate what is essential from what is merely impressive in a demo.
What Is Downtime Tracking Software?
Downtime tracking software records when equipment is not producing, how long it stays that way, and why. At its core it performs four jobs:
- Collects machine data, from PLCs, controllers, sensors, and operators.
- Detects stops and classifies them as running, idle, faulted, or planned.
- Stores each event with timestamps, asset, and reason.
- Reports the results through live displays, alerts, and analysis.
The simplest versions are web forms where operators log stops by hand. The most capable are connected platforms that read signals automatically, assign fault-based reasons, notify responders, link to maintenance systems, and keep years of history for analysis. Most plants need something in between, and the right point on that spectrum depends on how many machines you run, how fast you want to respond, and how much you want to improve.
Why Software Beats Spreadsheets and Clipboards
Many plants start with paper and spreadsheets. They are not wrong to, but they hit limits quickly.
- Accuracy. Software timestamps stops precisely instead of relying on estimates and memory.
- Speed. Data is available the moment it happens, not after someone types it in.
- Consistency. Controlled reason codes and shared definitions keep data comparable across shifts and lines.
- Scale. Adding a machine means connecting it, not adding another stack of forms.
- Analysis. Pareto charts, trends, and OEE calculate automatically instead of through fragile spreadsheet formulas.
- Response. Alerts and escalation notify the right person while the machine is still down.
- Memory. History accumulates in one place, so you can prove whether a fix worked.
If you want to see how the manual and automated approaches compare in detail, we cover that in our guide to manual versus automated downtime tracking.
Core Features to Look For
Not every feature matters equally. These are the capabilities that tend to determine whether a downtime system succeeds.
Automatic data collection
The software should read machine signals directly: run status, part counts, speed, alarms, and fault codes. Look for support for the protocols your equipment uses, such as OPC UA, Modbus, EtherNet/IP, and Siemens S7, plus options for older machines using I/O modules. If collection depends on manual entry, you have a logging tool, not a tracking system.
Flexible stop detection
You should be able to configure what counts as a stop: which signals to use, minimum duration, debounce times, and how to treat micro-stops, idle, blocked, and starved states. Fixed rules that cannot be tuned will give wrong numbers on machines that behave differently from the vendor's assumptions.
Reason code management
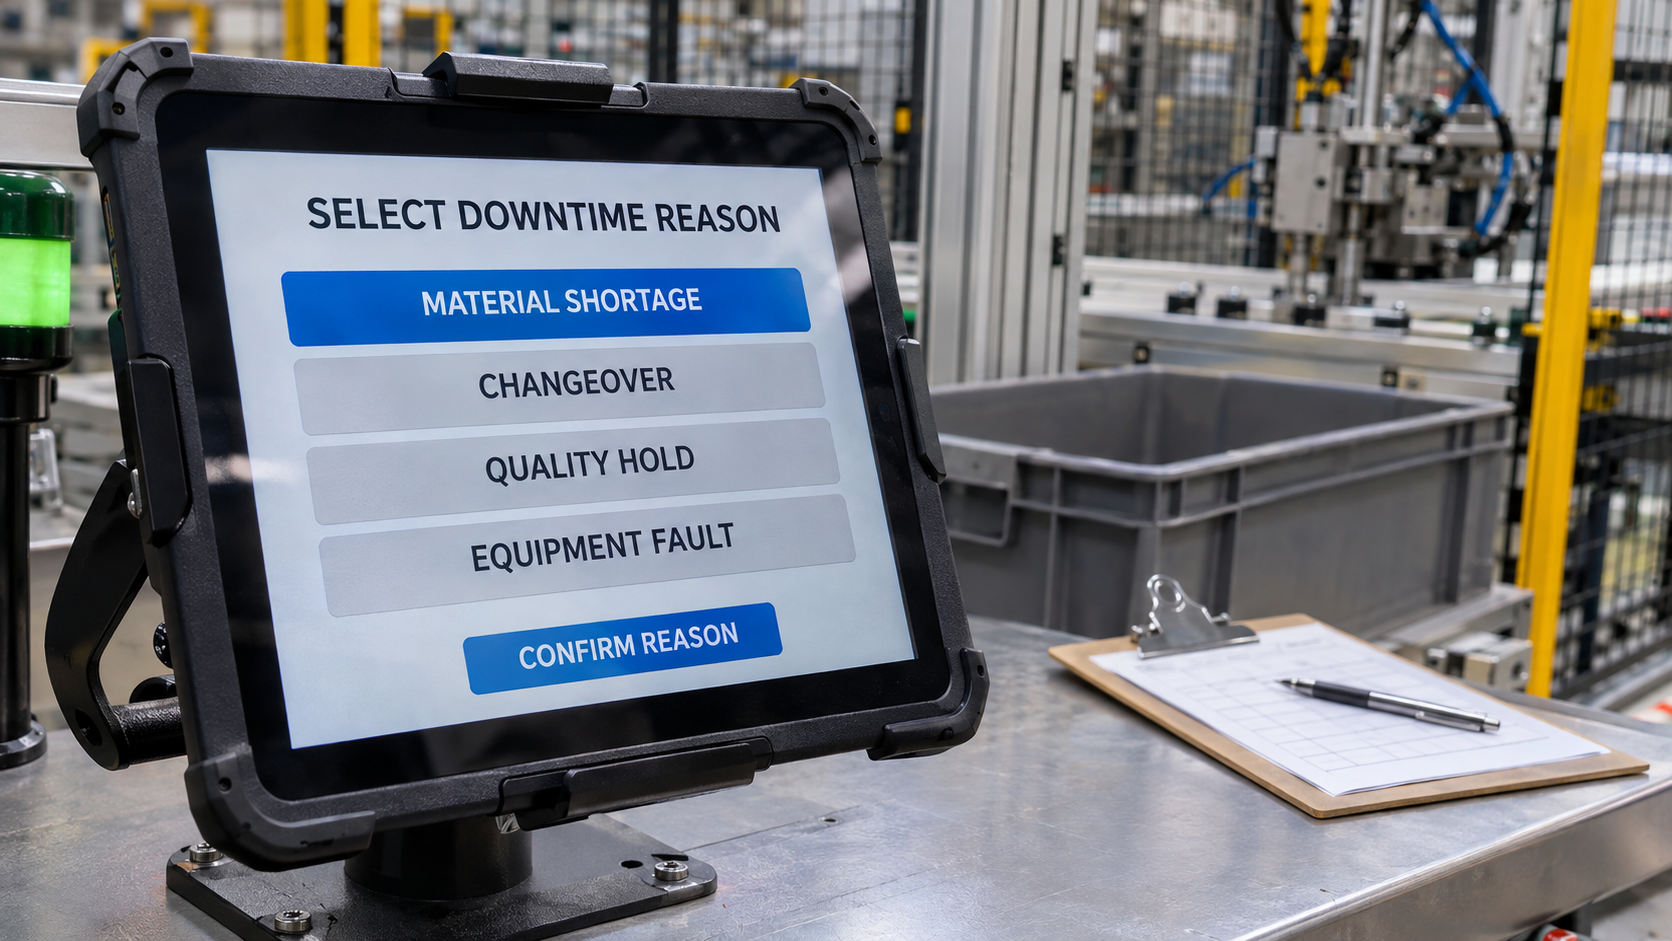
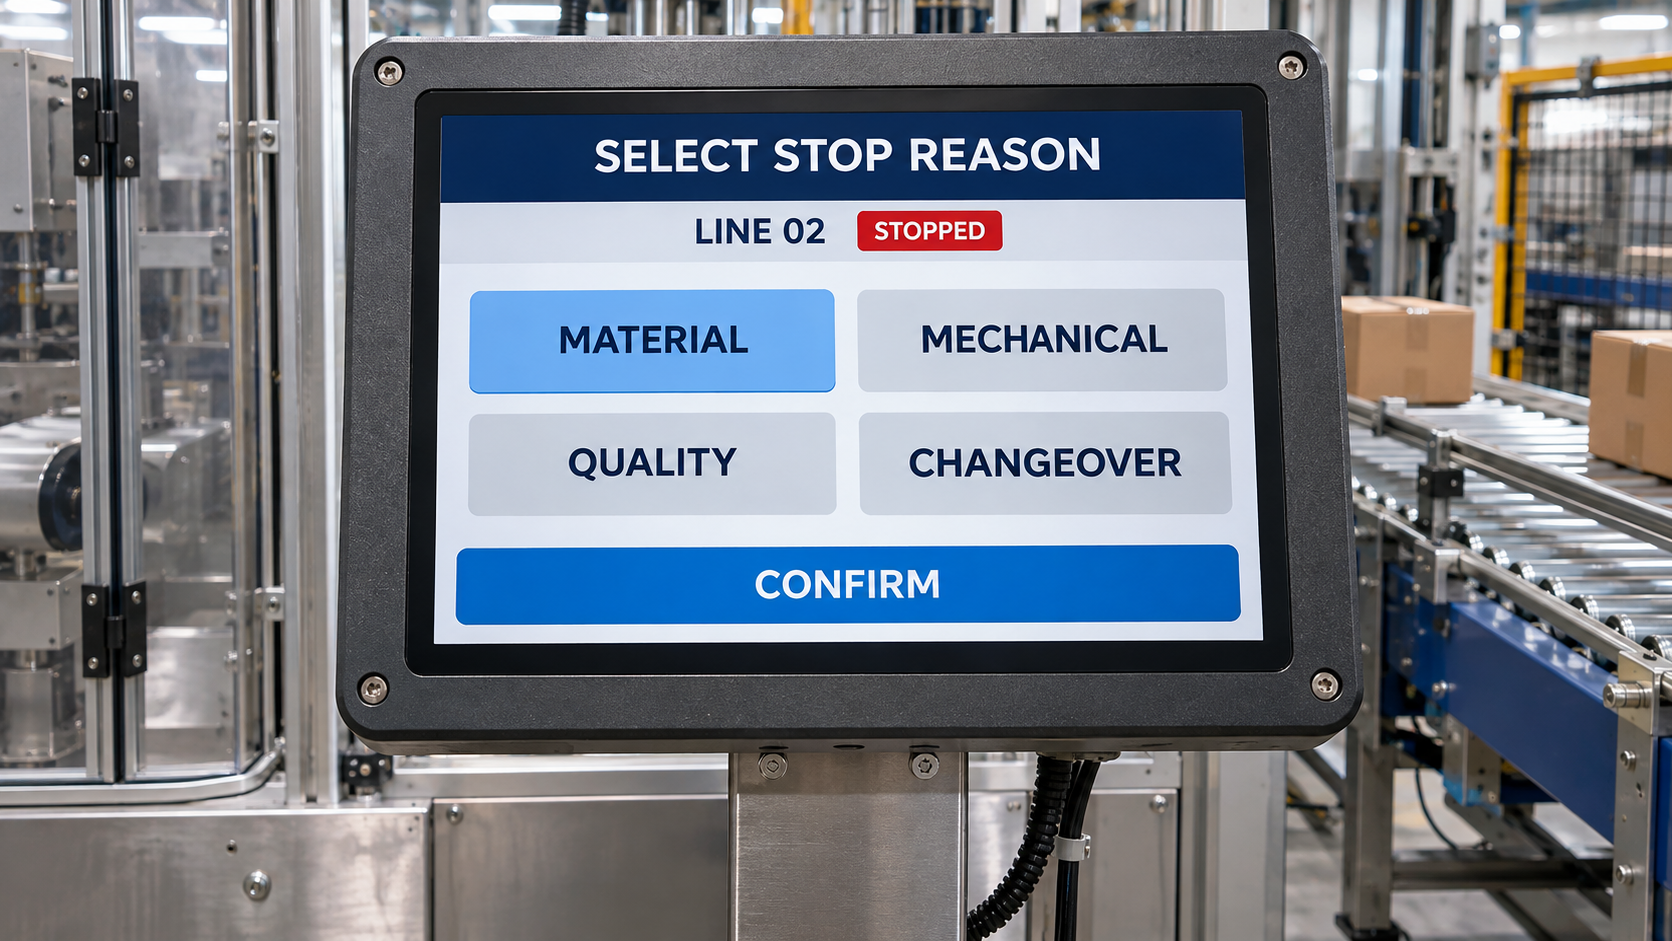
Look for hierarchical reason codes that you can edit yourself, automatic assignment from fault codes, quick operator selection on a touchscreen, and a workflow for unassigned events. The ability to add, retire, and reorganize codes without calling the vendor is more valuable than it sounds.
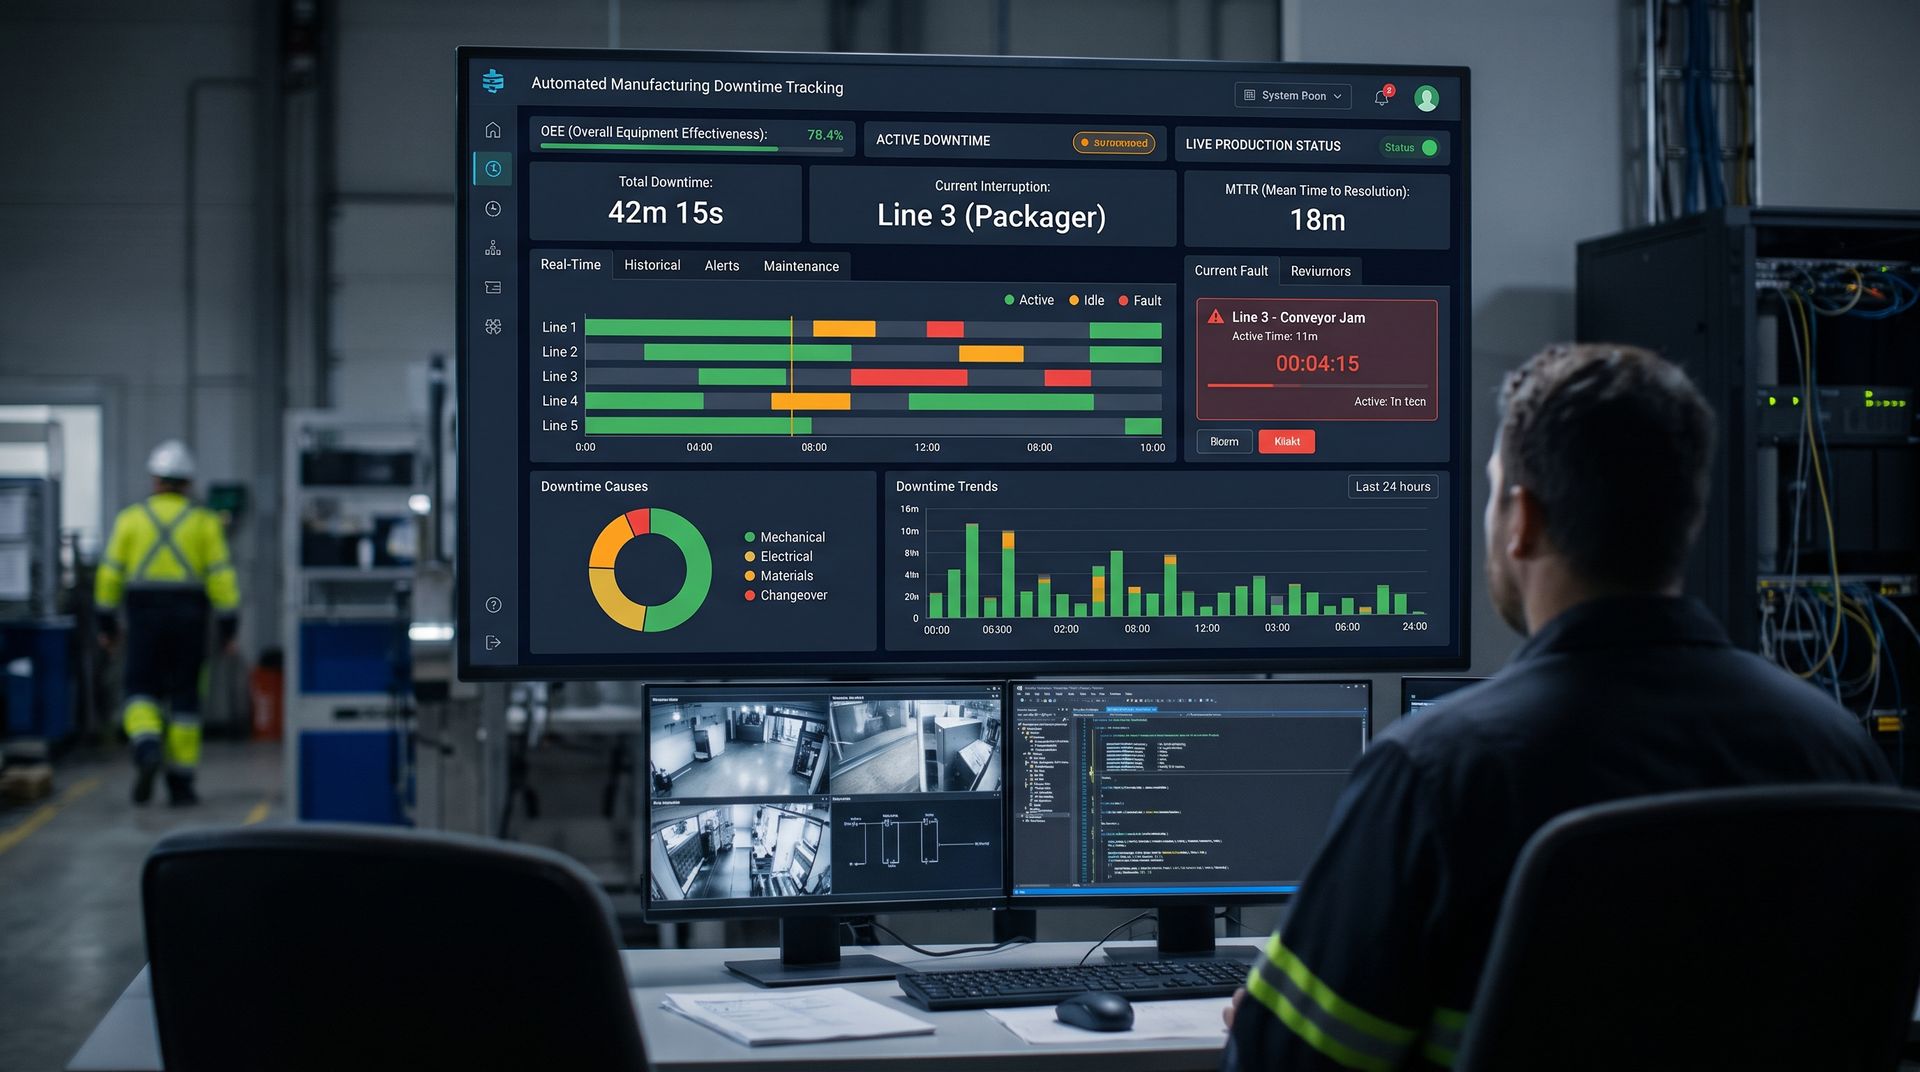
Real-time dashboards and displays
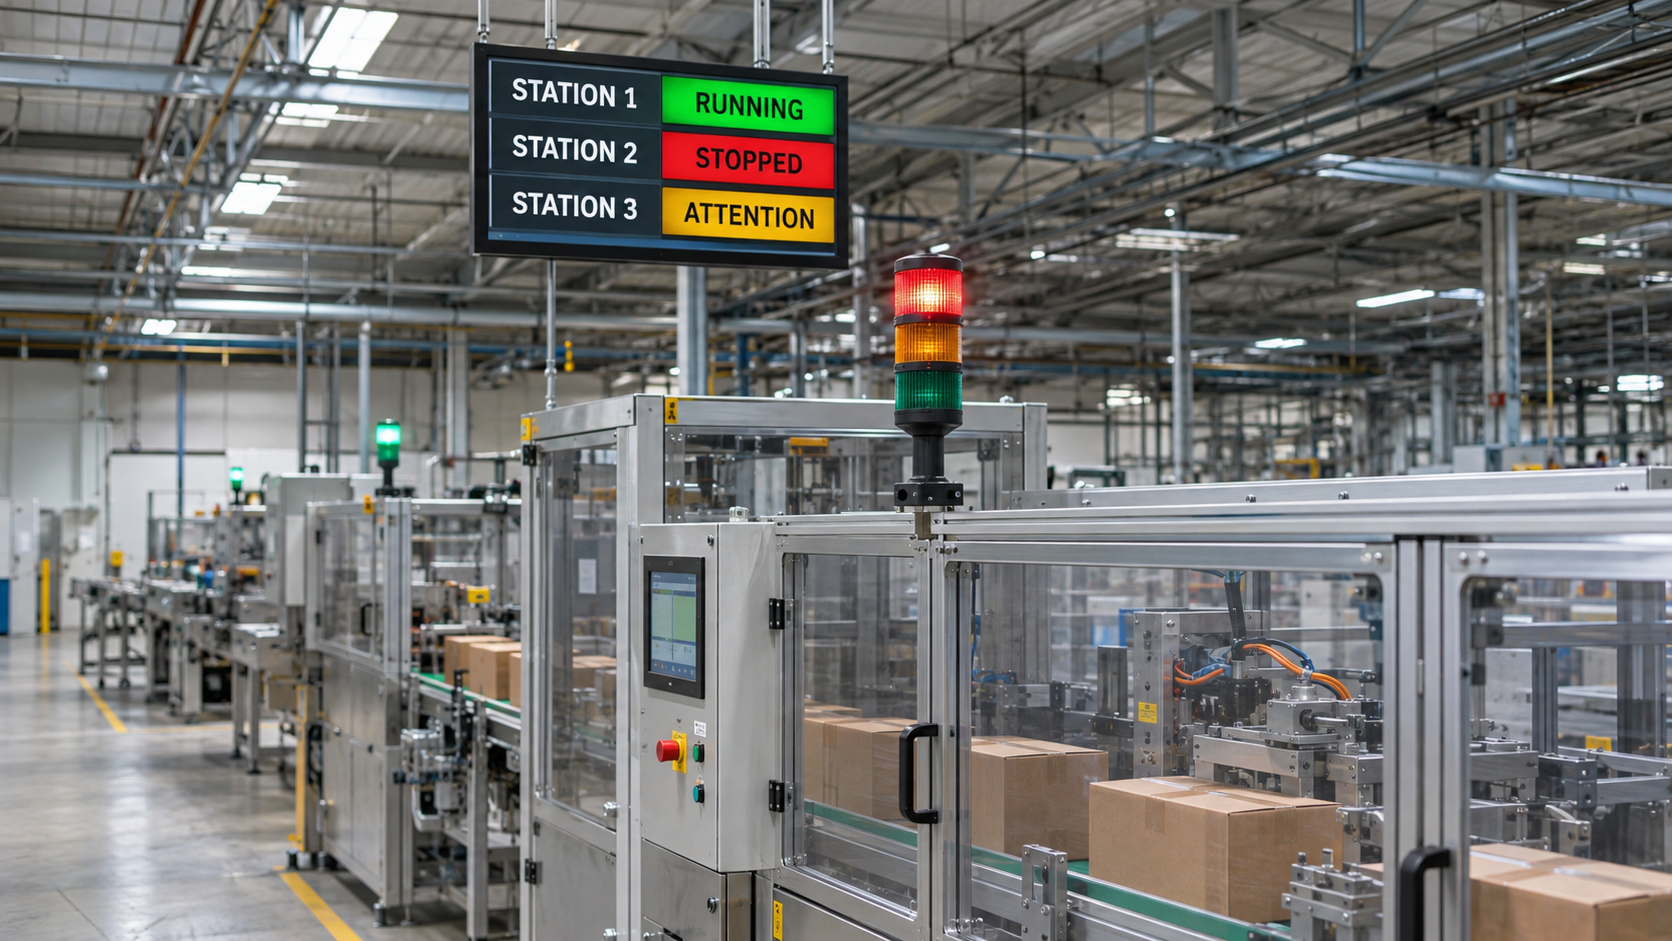
You need a live view of machine and line status, current shift performance, and top losses, shown on floor displays, supervisor screens, and mobile devices. The best displays are simple enough to read from across the room.
Alerts and escalation
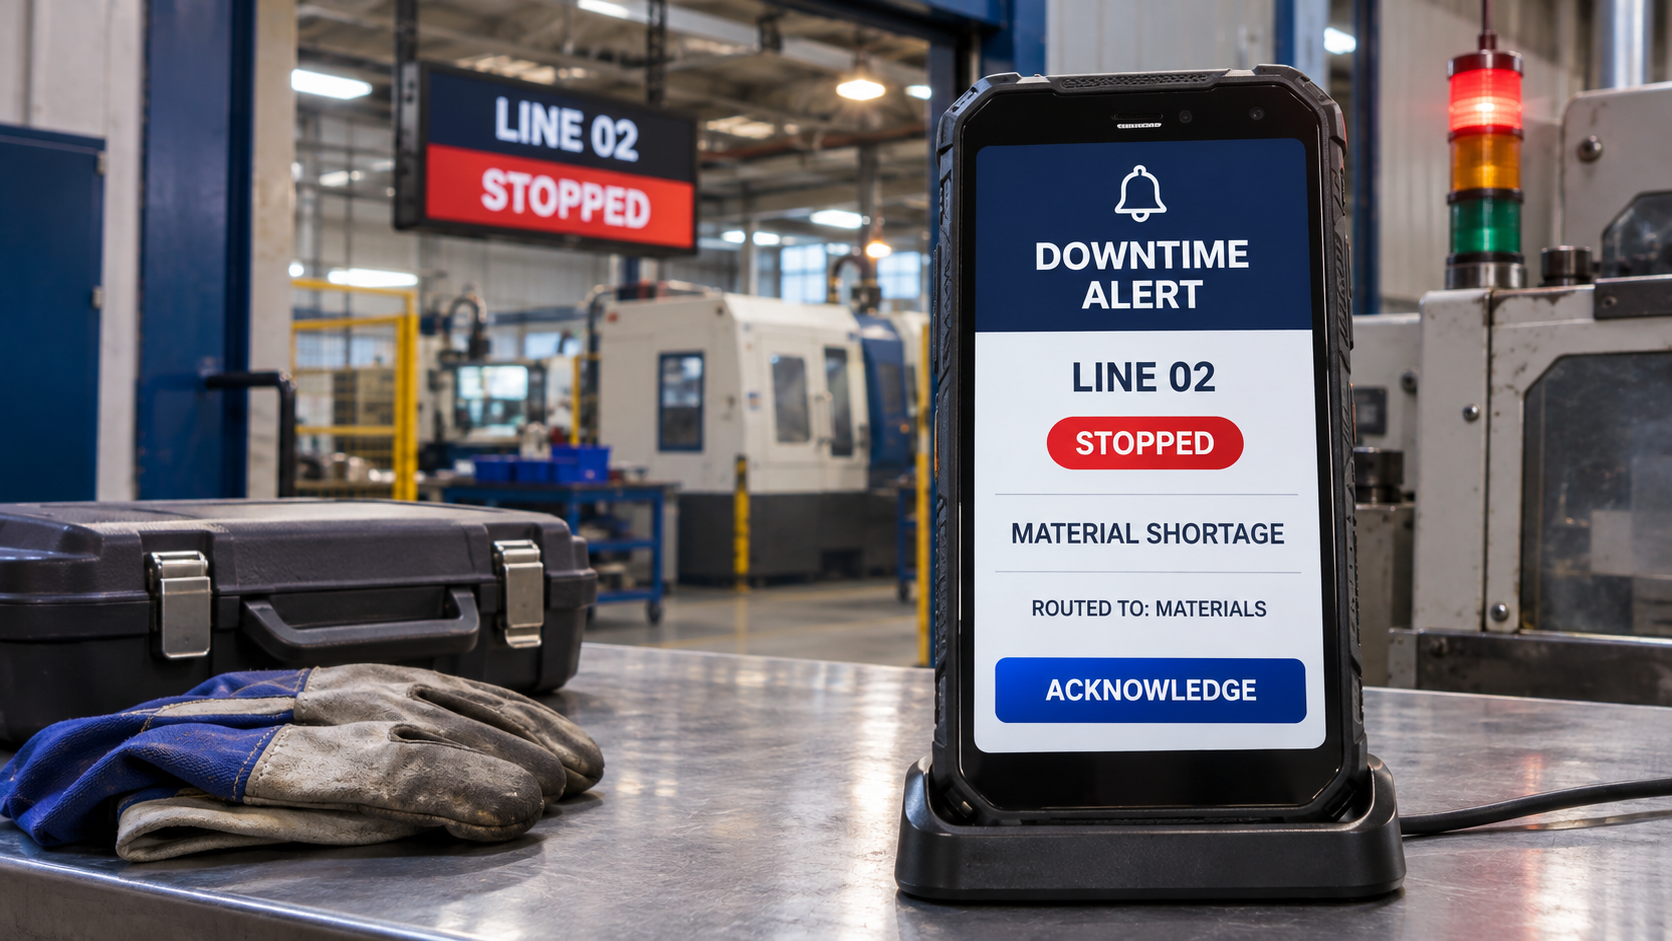
The system should notify the right people by text, email, or app when a stop exceeds a threshold, and escalate if nobody responds. Routing by call type and acknowledgment tracking are signs of a mature system.
Reporting and analysis
Standard reports should include Pareto charts by reason and asset, downtime by shift and product, trend over time, MTBF and MTTR, and planned versus unplanned breakdowns. You should also be able to export data for your own analysis and build custom reports.
OEE calculation
If OEE matters to you, the software should combine availability, performance, and quality correctly, and let you drill from the OEE number down to the individual stops and rejects behind it.
Historical storage
Long-term, time-stamped storage lets you compare periods, validate improvements, and investigate past events. Ask how much history is kept and how fast it can be queried.
Suggested in-article image: architecture diagram of machines, data connector, historian, dashboards, and alerts.
How the Software Connects to Your Machines
Connectivity is where many projects succeed or stall, so examine it closely.
- PLC and controller connections. Modern controllers can be read through standard industrial protocols. A data connector layer that supports many protocols reduces the number of separate tools you need.
- CNC and machine tools. Controllers such as FANUC can be reached through OPC servers, FOCAS-based software, or MTConnect adapters.
- Legacy equipment. Small I/O modules can read a relay, stack light, or sensor, giving useful state data from machines with no network port.
- Device-level connectivity. Device connectors and IoT connectors extend collection to a wider range of sensors and gateways.
- Network security. Collection should respect your segmentation, use encrypted protocols where available, and avoid overloading controllers with unnecessary polling.
Ask for a connectivity assessment before you commit. A vendor who can tell you which of your machines are easy, which need extra hardware, and which are not worth connecting yet is a vendor who understands plants.
The Role of a Data Historian
Behind good downtime software there is usually a data historian. A data historian stores every signal and event with a timestamp, which gives the software something solid to analyze and lets you look at what the machine was doing before, during, and after a stop.
Why this matters when choosing software:
- Root cause analysis. Downtime events alone tell you that something happened. Historian data helps you find out why.
- One source of truth. The same data feeds dashboards, reports, alerts, and integrations without separate collection for each.
- Long-term history. You can keep years of events and process data for trends and audits.
- Flexibility. Because data is stored in a general-purpose way, you are not locked into one report format.
Software that stores only summary numbers may be quicker to launch but harder to investigate and harder to move away from later.
Operator Interfaces That People Will Use
A technically perfect system fails if operators avoid it. Evaluate the operator experience as carefully as the analytics.
- Speed. Choosing a reason should take a few seconds and one or two taps.
- Clarity. Large buttons, simple language, and an interface designed for gloves and noisy environments.
- Context. The screen should show what the machine is doing and what the system needs from the operator.
- Minimal typing. Use selections and defaults instead of free-text fields wherever possible.
- Location. Touchscreens at the machine, tablets, or HMI integration, depending on your floor.
A well-designed
HMI SCADA layer is often the natural place to put the operator screen, since operators already look at it to run the machine.
Alerts, Andon, and Response Tracking
Tracking stops is useful. Shortening them is valuable. Look for features that connect downtime detection to response.
- Automatic notification when a stop exceeds a threshold.
- Routing by category so maintenance, materials, and quality teams get the right calls.
- Acknowledgment and arrival timestamps to measure response time separately from repair time.
- Escalation if a call goes unanswered.
- Andon-style displays and stack light integration for visibility on the floor.
A dedicated alarm logging and notification capability can supply this layer and keep the history for later review.
Integrations with ERP, MES, and CMMS
Downtime data becomes more powerful when it connects to other systems.
- ERP and MES. Pull in work orders, products, and schedules so downtime is tied to the job and the plan, and push back actual run time or production counts.
- CMMS and maintenance systems. Create or link work orders automatically when a stop exceeds a threshold, and bring back repair information so you can see whether fixes hold.
- Quality systems. Connect stops and rejects to lot and inspection data.
- Business intelligence tools. Provide clean data to analysts using the tools they already know.
- Open interfaces. Look for documented developer tool APIs and standard export options so integrations are practical and you are not dependent on the vendor for every change.
Ask what integration looks like in practice: which connections are standard, which require custom work, and who builds and maintains them.
Deployment Options: On-Premises, Cloud, or Hybrid
Where the software runs affects cost, security, and performance.
On-premises. The software runs on servers inside your facility. You control the environment, data stays on your network, and operation does not depend on internet connectivity. You are responsible for hardware, patching, backups, and availability.
Cloud. The vendor or a cloud provider hosts the system. Setup can be quicker, scaling is easier, and multi-site visibility is simpler. You depend on connectivity and need to examine data handling, access controls, and encryption carefully.
Hybrid. Collection and a local historian run in the plant, and selected data replicates to the cloud for reporting and multi-site analysis. Many manufacturers land here because it keeps the plant running independently of the internet while still enabling enterprise visibility.
Whichever you choose, ask how the system behaves when the network drops. Good software buffers data locally and fills in the gap, so a connection problem does not create a hole in your records. Also confirm that collection paths are secured with encrypted transport and that remote access follows sound practices.
Build vs Buy
Some plants consider building downtime tracking in-house using a historian, a database, and custom dashboards. Others buy a packaged product. Both can work.
Building makes sense when you have strong internal controls and software skills, unusual requirements that products do not meet, and a commitment to maintain the system for years.
Buying makes sense when you want faster deployment, proven logic for stop detection and reporting, vendor support, and a roadmap you do not have to fund yourself.
A middle path is common: use a flexible industrial platform for data collection, storage, alarms, and visualization, then configure it to your downtime rules instead of writing everything from scratch. That approach gives you speed without losing control.
Evaluation Checklist
Use this list when comparing options.
- Connectivity: Does it support your PLCs, CNCs, and legacy machines without heavy custom work?
- Stop detection: Can you configure rules, thresholds, and states to match your machines?
- Reason codes: Can you edit the list yourself? Does it assign fault-based reasons automatically?
- Operator experience: Can a stop be classified in seconds, on the hardware you have?
- Real-time visibility: Are live displays and mobile views included?
- Alerts: Does it support routing, acknowledgment, and escalation?
- Analysis: Does it provide Pareto, trend, MTBF, MTTR, and OEE with drill-down?
- History: How much data does it keep, and how fast can you query it?
- Integrations: Does it connect to your ERP, MES, and CMMS, and offer open APIs?
- Deployment: Does it fit your on-premises, cloud, or hybrid preference?
- Security: Does it support segmentation, encrypted transport, role-based access, and audit trails?
- Data ownership: Can you export all your data in a usable format?
- Support: Does the vendor understand plant floors and provide help during and after deployment?
- Cost model: Are licensing, hardware, implementation, and support costs clear and predictable as you add machines?
Questions to Ask Vendors
- Which of our machines can you connect today, and which would need additional hardware?
- How do you detect stops, and can we change the rules ourselves?
- What happens to data if the network goes down?
- How are reason codes managed, and who can change them?
- Can you show a customer with equipment similar to ours?
- How do you handle time synchronization across devices?
- What does a typical pilot look like, and how long until we see usable data?
- How is licensing structured as we add machines, users, and sites?
- What does it take to export our data if we leave?
- Who supports the system after go-live, and how quickly?
Pay attention to how vendors answer. Specific, practical answers about your equipment are a better sign than polished slides.
Implementation: How a Good Rollout Looks
1. Define goals and scope. Decide which problems you want to solve and which line or machine to start with.
2. Run a connectivity assessment. Identify what can be connected easily and what needs extra work.
3. Standardize definitions. Agree on what counts as downtime, minimum stop length, planned versus unplanned, and a short reason list.
4. Pilot on one line. Connect the machines, configure detection, and compare results with manual records for a few weeks.
5. Add visibility and response. Put live displays on the floor, set up alerts, and start a daily review of top losses.
6. Train and communicate. Explain the purpose to operators, involve them in reason codes, and show early wins.
7. Expand in waves. Replicate the pattern on other lines and sites.
8. Review and refine. Revisit rules, reason codes, and reports quarterly as the plant changes.
Cost Factors to Understand
Prices vary widely, so instead of quoting numbers, here are the items that drive total cost.
- Software licensing, which may be per machine, per tag, per user, or per site.
- Hardware, including I/O modules for legacy machines, gateways, panels, and displays.
- Implementation, including configuration, integration, and testing.
- Training and change management.
- Infrastructure, such as servers, network equipment, or cloud services.
- Ongoing support and updates.
Compare options on total cost across several years, and weigh that against the value of recovered production at your constraint. A system that costs more but connects to your machines without custom work and scales cleanly is often cheaper in the long run.
Common Mistakes When Choosing Software
- Buying for the demo. Polished dashboards matter less than whether the system can read your machines.
- Ignoring older equipment. Many plants find their biggest losses on machines that are hardest to connect.
- Skipping the pilot. A short, real pilot reveals problems that no sales conversation will.
- Over-customizing at the start. Begin with standard reports and rules, then adapt as you learn.
- Forgetting the operators. If the interface is slow or confusing, data quality will suffer.
- Locking into closed systems. Make sure you can export data and integrate with other tools.
- No plan to act. Software shows you the problem. Someone still has to own the fixes.
Industrial Data Collection and OEE Monitoring
Strong downtime tracking software builds on reliable industrial data collection. Real-time data acquisition from PLCs, SCADA systems, and IoT devices supplies machine status, production counts, and fault codes. With that foundation, manufacturing teams can monitor OEE, support predictive maintenance, perform root cause analysis, and drive continuous improvement across lines and sites.
What should downtime tracking software do?
It should automatically collect machine signals, detect stops with configurable rules, capture reasons through fault codes and quick operator selection, store every event with timestamps, and present live dashboards, alerts, and reports such as Pareto charts, MTBF, MTTR, and OEE. Good systems also integrate with ERP, MES, and maintenance tools.
Downtime Tracking Software: A Quick Review
Use this review before you shortlist vendors.
- Prioritize machine connectivity, configurable stop detection, editable reason codes, and a fast operator interface.
- Confirm historian storage, alerts, open integrations, data export, and a pilot before committing.
Frequently Asked Questions About Downtime Tracking Software
1. What is the difference between downtime tracking software and OEE software?
Downtime tracking focuses on when and why equipment stops. OEE software combines availability, performance, and quality. Many platforms offer both, and accurate downtime data is the foundation for the availability part of OEE.
2. Can the software work with older machines?
Often yes. Small I/O modules can read a relay, stack light, or sensor and provide run or stop status even when the machine has no network connection. Ask the vendor how they handle your specific equipment.
3. Do operators still have to enter reasons?
Usually for some stops. Fault codes can assign many reasons automatically, and operators select the rest from a short list on a touchscreen. Good systems make this a matter of seconds.
4. Is cloud or on-premises better for downtime tracking?
Neither is always better. On-premises gives you control and independence from the internet, while cloud simplifies multi-site visibility. Many plants choose hybrid, collecting locally and replicating selected data to the cloud.
5. How long does implementation take?
A focused pilot on one line can often show usable data within weeks, depending on connectivity and scope. Broader rollouts take longer and depend on equipment variety and organizational readiness.
6. How do I know the data is accurate?
Run the system alongside manual observation for a few weeks, compare results, and investigate differences. Validate time synchronization, stop detection rules, and reason code assignment before relying on the numbers.
Choose Downtime Tracking Software That Fits Your Plant with Empowered Automation Solutions
The best downtime tracking software is the one that actually connects to your machines, fits the way your operators work, and keeps giving you answers as your plant changes. Empowered Automation Solutions builds industrial data software for real plant floors: connectors for PLCs, CNC controls, and devices, a high-performance historian, alarm logging and notification, and visualization tools that put live status and downtime analysis in front of the people who need it. Our engineers speak controls, so we can help you assess your equipment, design stop detection and reason codes, and roll out in a way your team will adopt.
Whether you are evaluating your first system or replacing one you have outgrown, start with a conversation. Take advantage of our free connectivity assessment to see what your equipment can already report, or explore our data historian and visualization tools to see what a connected downtime system looks like. Your machines already have the data. The right software turns it into uptime.
You might also like