Bottleneck Analysis
Bottleneck Analysis: Finding and Unlocking Your Plant's True Constraint
In high-speed manufacturing, a production line is only as fast as its slowest link. This is the foundational law of the Theory of Constraints: at any given moment, every manufacturing line has exactly one machine or process that dictates the total throughput of the entire system. That constraint is your bottleneck.
The financial implications of this rule are absolute. An hour of lost production on your bottleneck machine is an hour of lost production for the entire factory. Conversely, spending capital and engineering hours to optimize, speed up, or automate a machine that is not the bottleneck produces exactly zero additional finished goods at the end of the shift. It simply causes work-in-progress (WIP) inventory to pile up faster in front of the true constraint.
Despite the mathematical simplicity of this concept, identifying and resolving the true operational bottleneck on a complex, dynamic packaging or processing line is one of the hardest challenges in manufacturing. Bottlenecks wander, hidden constraints shift between products, and inter-machine buffering masks the real points of friction.
Here is how modern plants mismanage bottleneck identification, what it costs them, and how to use advanced automation and data historians to unlock your line’s true capacity.
Mistake #1: Confusing the "Slowest Nameplate Rating" with the Dynamic Bottleneck
Why it happens: When a line is designed, engineering teams lay out machines based on their OEM nameplate specifications: for example, a filler rated for 300 units per minute (UPM), a labeler rated for 350 UPM, and a case packer rated for 400 UPM. On paper, the filler is the designed bottleneck. Engineering teams therefore focus all their continuous improvement efforts on the filler.
What it costs: Real-world operations rarely mirror clean OEM design specifications. If the downstream labeler experiences high-frequency micro-jams, poorly tuned servo indexing, or frequent ribbon changes, its effective operating speed might drop to 260 UPM. When that happens, the labeler backs up, fills the accumulation conveyor, and forces the 300 UPM filler to stop.
The plant spends capital trying to optimize the filler, wondering why line throughput never increases, when the actual constraint governing total production is the unstable labeler downstream.
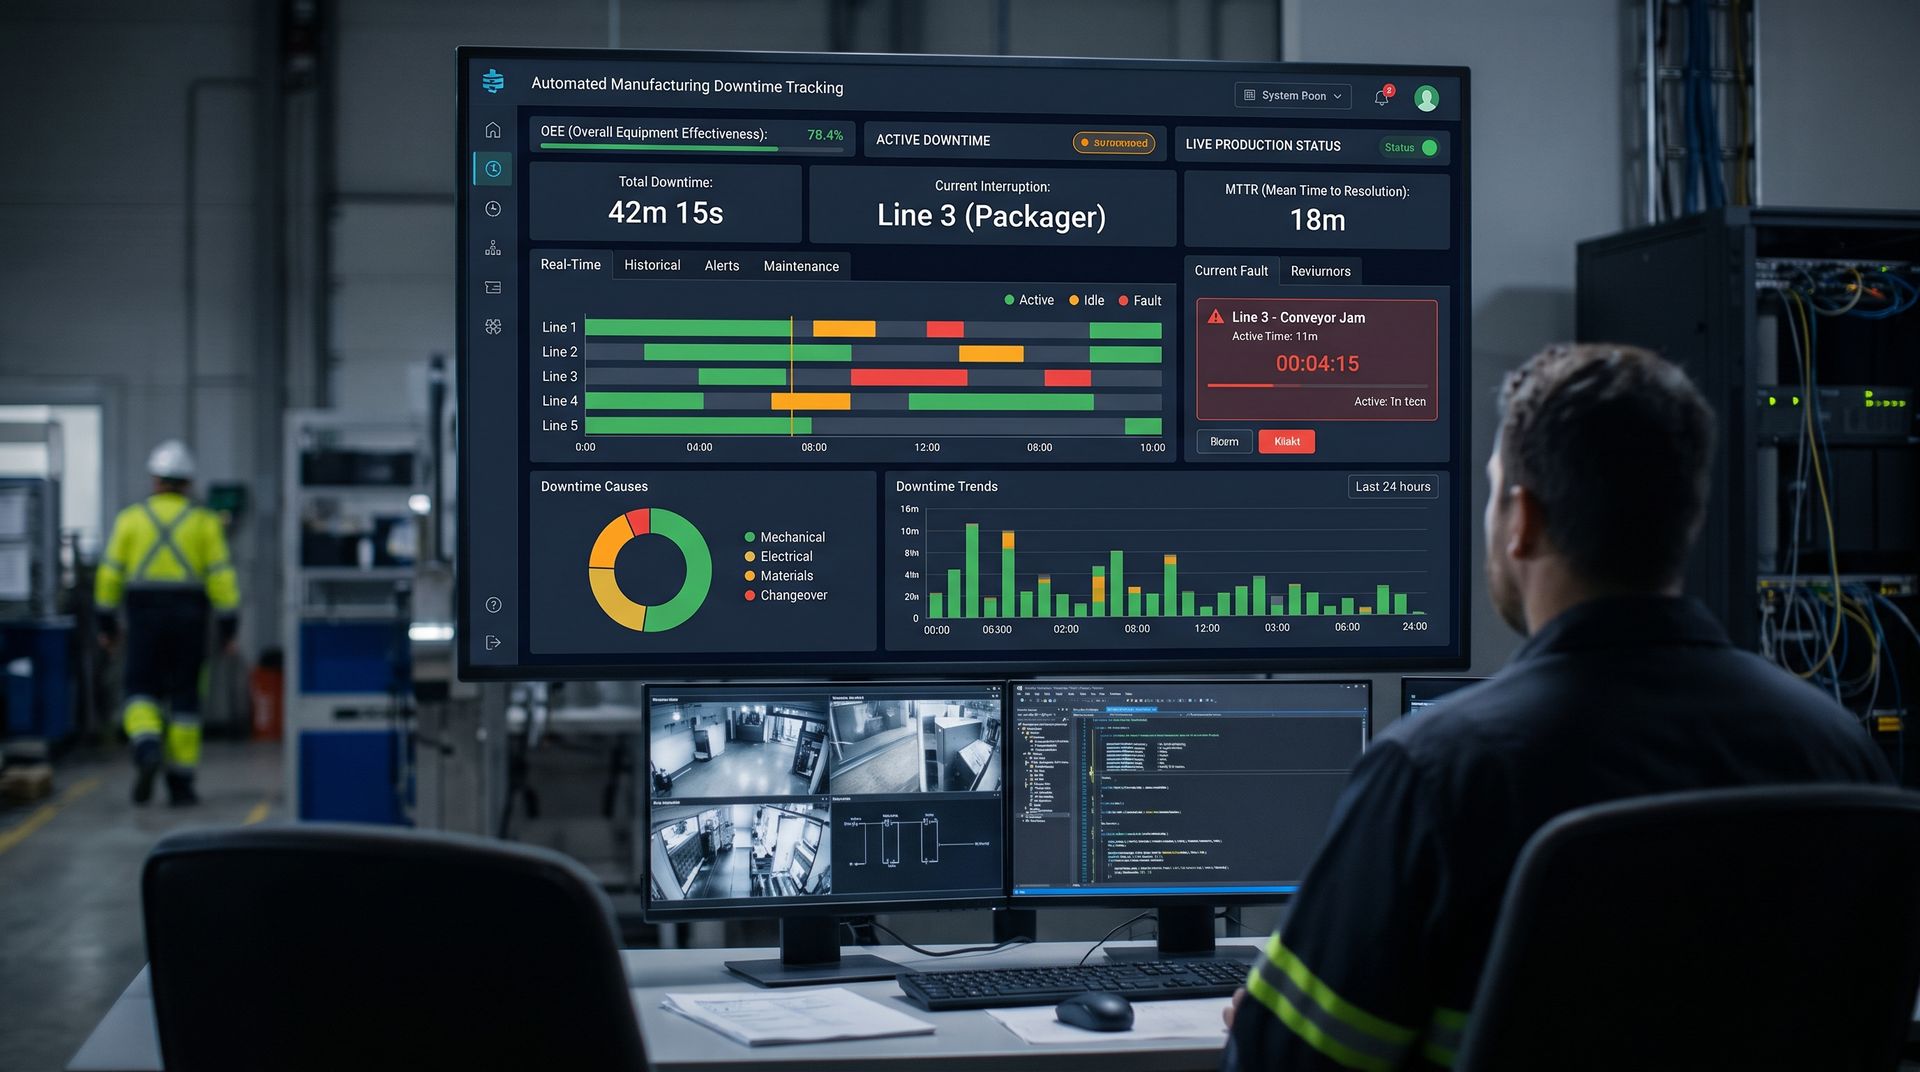
The fix: Track instantaneous cycle times and machine states dynamically, not theoretical nameplate capacities. Empowered Automation configures SCADA visualization tools that measure the actual real-time throughput and machine states across every contiguous asset on a line. If an upstream machine is continually forced to pause due to a "blocked" condition, the constraint has shifted downstream, regardless of what the original engineering blueprints say.
Mistake #2: Misinterpreting Accumulation Conveyors and Buffer Dynamics
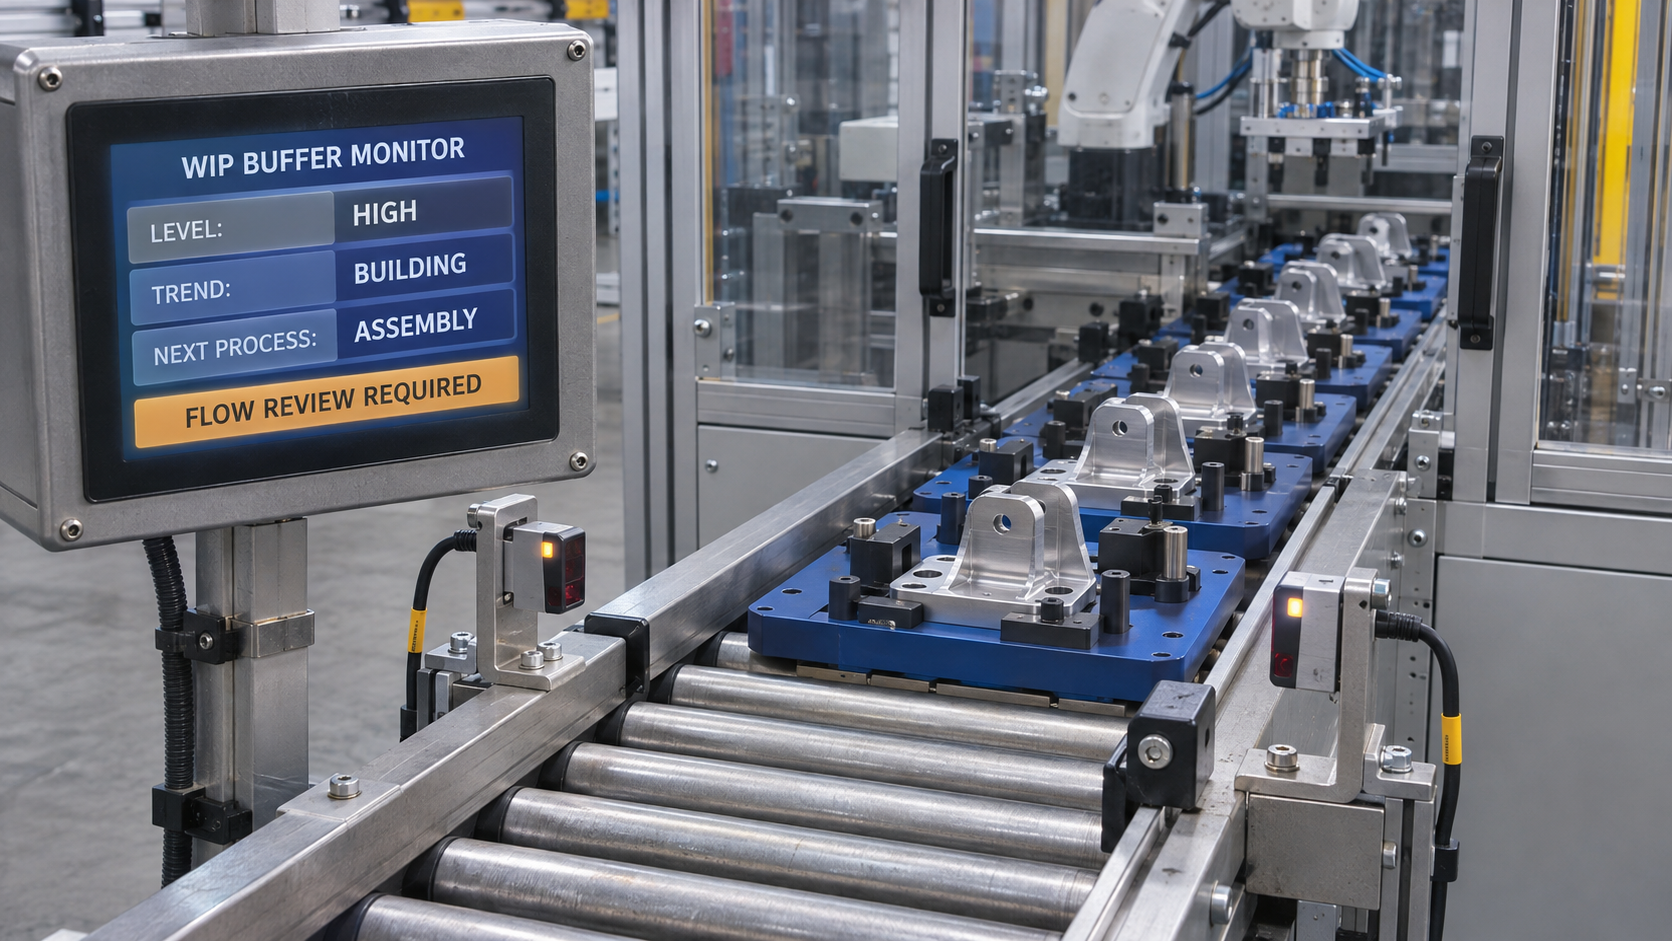
Why it happens: Accumulation tables and buffer conveyors are installed between machines specifically to absorb transient micro-stops without shutting down adjacent equipment. However, when plants do not track buffer fill percentages dynamically inside their control systems, these buffers hide the true source of line instability.
What it costs: A buffer delays the visible symptoms of a failure. A cartoner might stop for two minutes, during which time the accumulation conveyor absorbs the incoming containers. By the time the accumulator fills to capacity and the upstream filler finally shuts down, the cartoner has just restarted.
An engineer watching the line sees the filler stop and assumes the filler is at fault, completely missing the upstream-downstream ripple effect created by the buffer delay.
The fix: Instrument accumulation tables and conveyors with smart optical sensors or analog laser distance sensors integrated into the PLC and data historian. Log buffer fill levels as a continuous process variable ($0\text{ to }100\%$). By tracking buffer fill rates alongside machine states, you can see the precise propagation of line pressure:
$$\text{Buffer Rate of Change} = \text{Infeed Rate} - \text{Discharge Rate}$$
When the buffer level trends rapidly toward $100\%$, the downstream machine is failing to keep pace. When it drops to $0\%$, the upstream machine is starving the line.
Mistake #3: Ignoring the "Shifting Bottleneck" Phenomenon Across SKUs
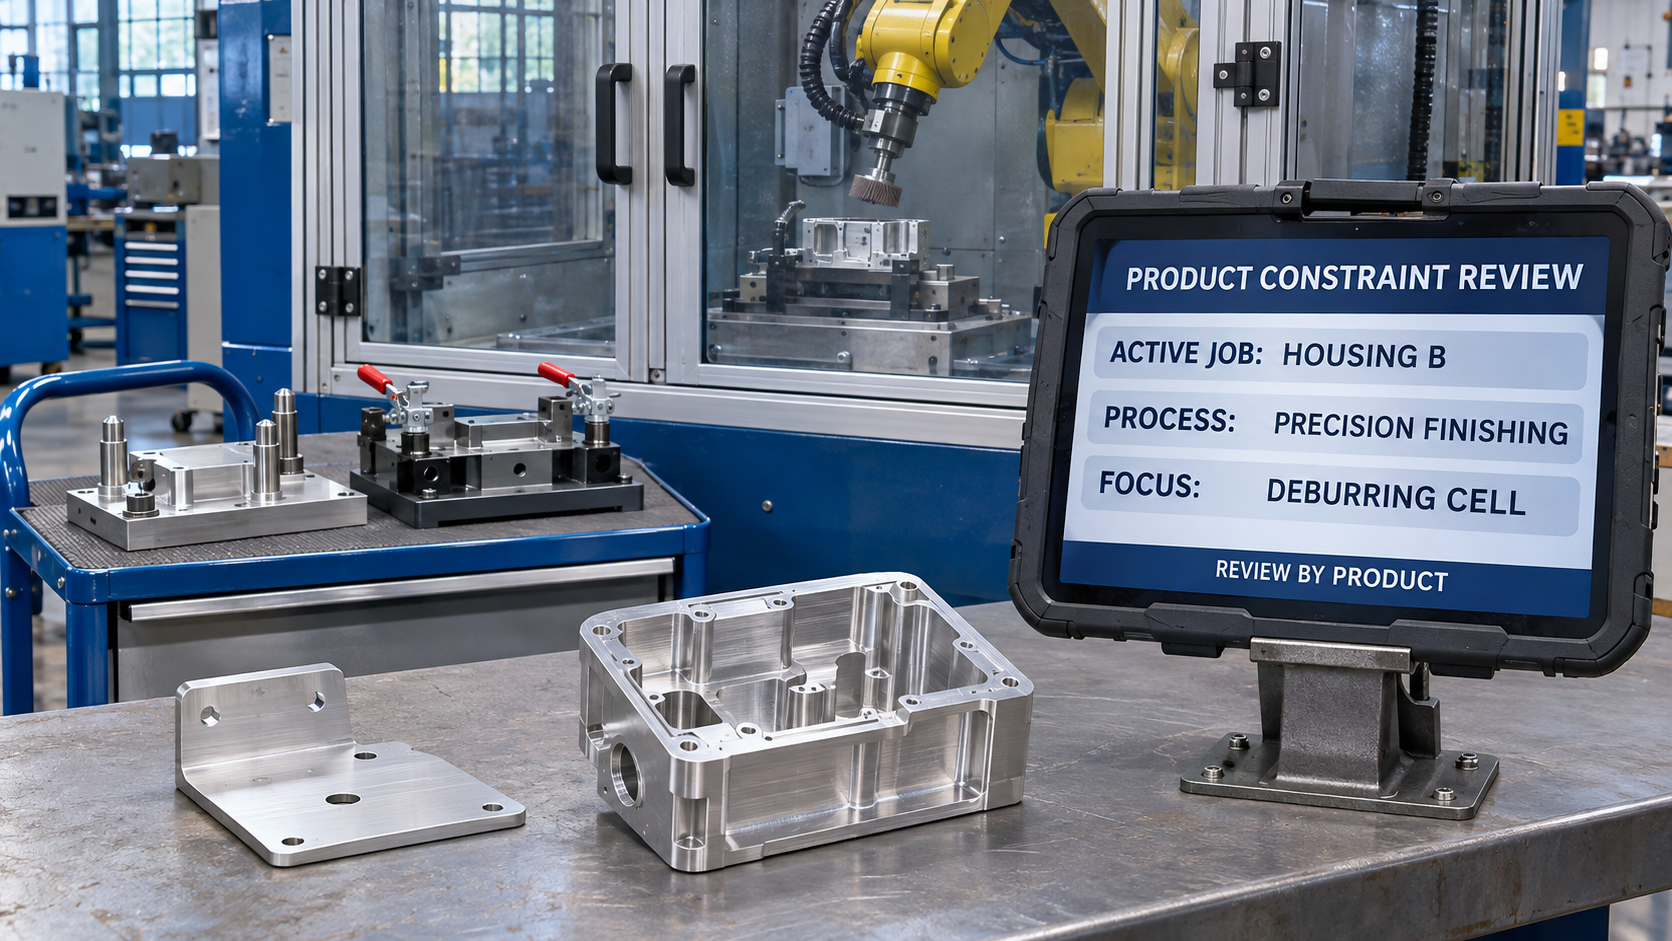
Why it happens: Most modern manufacturing lines are high-mix environments running dozens of different recipes, container sizes, and packaging configurations. Yet, plants frequently conduct a single bottleneck study on their flagship product and assume that same machine remains the constraint across all production runs.
What it costs: Different products place radically different stresses on different line assets. A line running a standard 12-ounce bottle might be limited by the filler speed. But when the line switches to a 32-ounce family-size bottle, the liquid filling volume takes twice as long, while the case packer handles half as many cases per minute.
Suddenly, the constraint shifts upstream to the filler. If the line switches to a complex promotional carton, the cartoner becomes the bottleneck. Operating with a rigid, single-bottleneck mindset means teams focus their maintenance and operational resources on the wrong equipment depending on the active recipe.
The fix: Implement dynamic, SKU-aware bottleneck tracking in your SCADA architecture. By contextualizing line state data with the active recipe from the PLC, the automation system dynamically recalculates which asset is the true constraint for that specific run. Operators and supervisors receive dynamic targets customized to the running SKU, ensuring focus is always directed at the active constraint.
Mistake #4: Relying on Historical Averages Instead of High-Density Time-Series Data
Why it happens: Plants attempt to locate bottlenecks by running weekly aggregate reports in Excel, looking at the average efficiency or total downtime hours for each machine over a seven-day period.
What it costs: Averages lie. A machine can show an average availability of 90% over a week, but during critical peak-demand operating windows, it might suffer intermittent, clustered slowdowns that trigger widespread starvation across the line. Aggregate numbers smooth out the critical dynamic interactions between machines, masking the true root cause of line throttling.
The fix: Utilize an industrial data historian to evaluate cycle-time distributions and inter-arrival times. By analyzing high-resolution time-series data, controls engineers can plot cycle time histograms for every machine. A machine with a tight, predictable cycle time distribution is stable; a machine with a wide, erratic distribution is introducing severe process variation that throttles the entire line, even if its "average" speed appears acceptable.
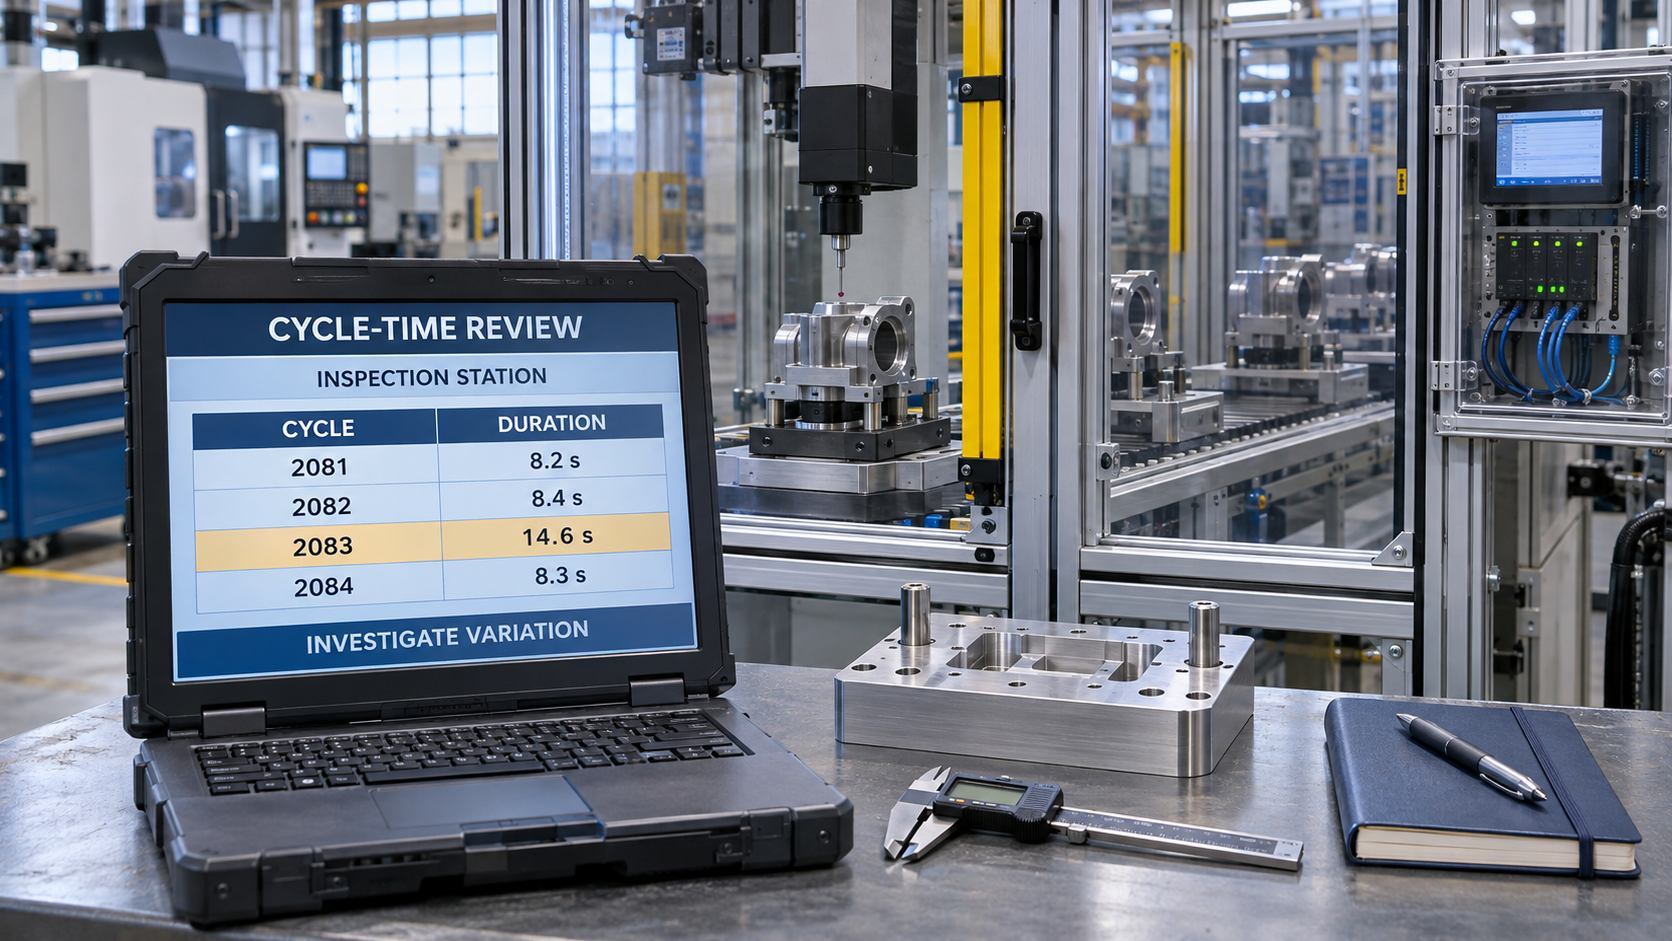
The Automation Architecture for Dynamic Bottleneck Detection
Uncovering your line's true constraint requires implementing standardized state logic across your entire automation architecture:
[ Machine 1: Infeed ] [ Accumulator Buffer ] [ Machine 2: Bottleneck ]
PLC State: PRODUCING ──► Fill Level: 92% ──► PLC State: FAULTED
Alarm: NONE Status: FILLING Alarm: DRIVE OVERCURRENT
Interlock: BLOCKED Interlock: ACTIVE CONSTRAINT
To automate this analysis:
- Program Blocked and Starved States: Every PLC program must explicitly log when the machine is physically capable of running, but cannot run because it is Starved (waiting for incoming product) or Blocked (unable to discharge finished product).
- Calculate the Percentage of Constraint Time: The true operational bottleneck at any given second is the machine that is actively faulted or running at reduced speed while it is neither starved nor blocked.
- Visualize Constraints in Real-Time: Display the active bottleneck dynamically on overhead SCADA monitors. When the line drops below target throughput, the system highlights the exact asset responsible for throttling production at that instant.
Bottleneck Analysis Audit Checklist
Evaluate whether your facility has the technical foundation required to identify its true manufacturing constraints:
- [ ] State Instrumentation: Does every machine’s PLC clearly differentiate between an internal fault, a downstream "Blocked" state, and an upstream "Starved" state?
- [ ] Buffer Telemetry: Are your accumulation tables and conveyors instrumented to track continuous fill percentages inside the SCADA system?
- [ ] Recipe/SKU Tracking: Can your control system dynamically identify shifting bottlenecks based on the active recipe and packaging geometry?
- [ ] Cycle-Time Resolution: Does your data historian collect cycle-time and interlock data at sub-second resolution to capture transient throttling?
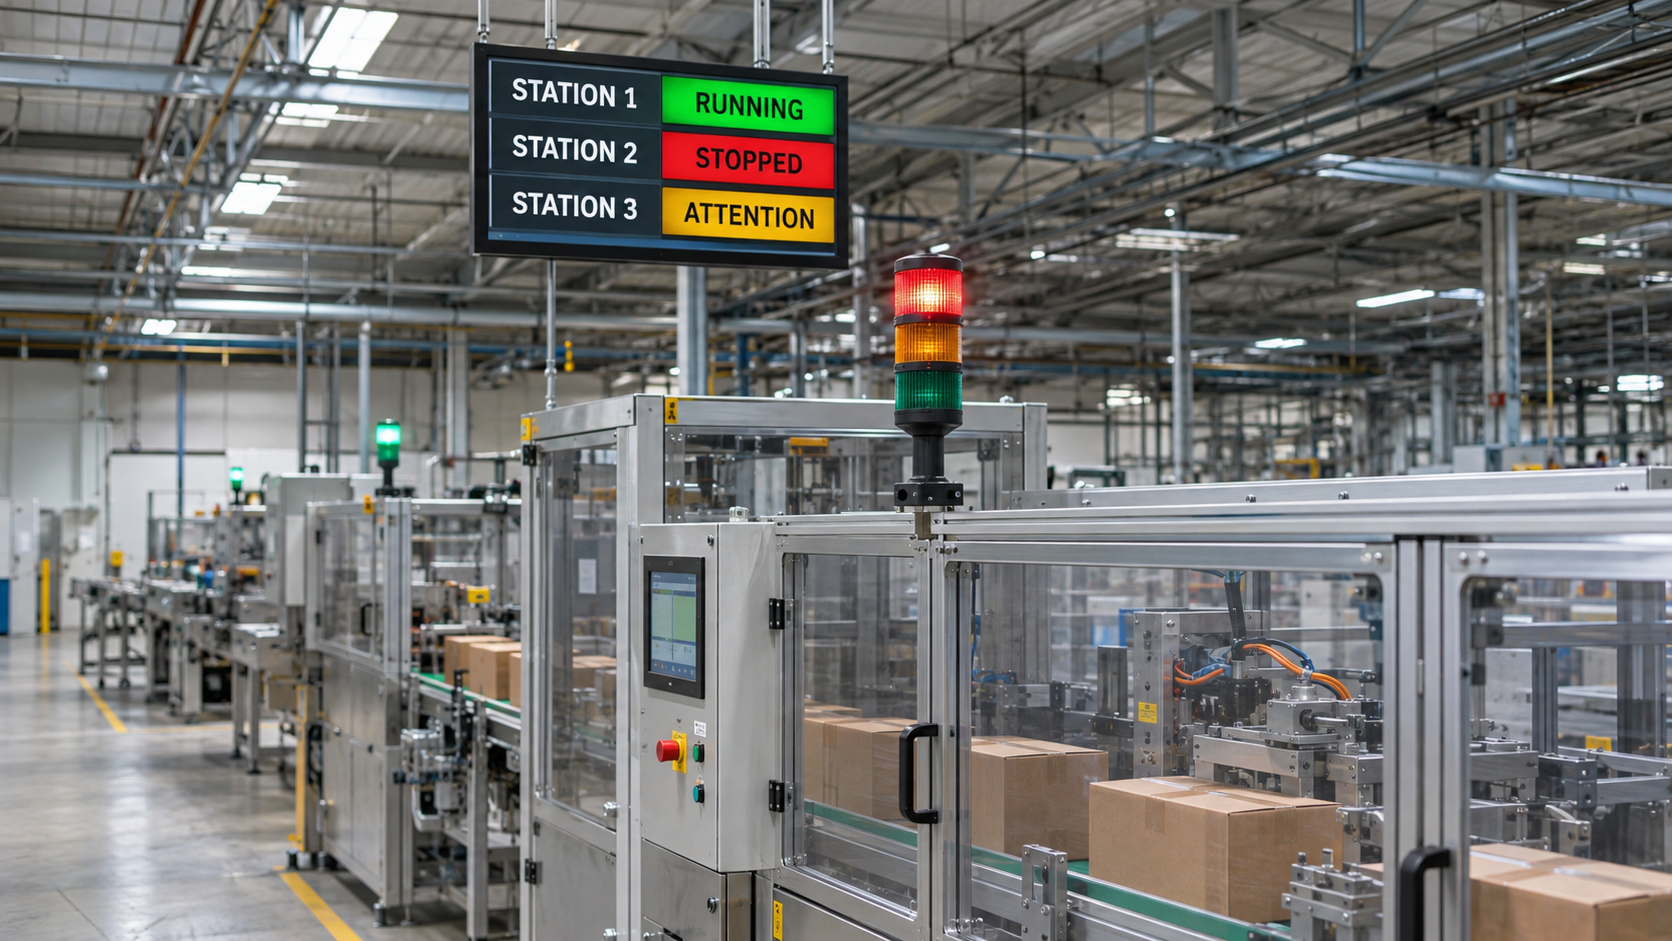
- [ ] Visual Management: Do plant-floor operators have clear, real-time visual indicators showing which machine is the current line constraint?
Conclusion
Optimizing a manufacturing facility is an exercise in focus. Upgrading equipment, re-tuning PID loops, and adding maintenance personnel to non-bottleneck processes consumes capital and engineering time without delivering a single dollar of additional revenue.
By utilizing standardized PLC state logic, real-time buffer monitoring, and high-resolution data historians, you can strip away the guesswork, pinpoint your line’s true dynamic constraint, and focus your capital investments where they directly drive bottom-line throughput.
Ready to Unlock Your Line’s True Capacity?
Empowered Automation Solutions helps manufacturers locate, analyze, and eliminate operational bottlenecks. Our team delivers complete Systems Integration, PLC and HMI programming, dynamic SCADA dashboarding, and industrial Data Historian deployments designed to expose line constraints in real-time. Whether you are rebalancing an existing packaging line or commissioning a new high-speed processing facility, we provide the automation intelligence you need to maximize output.
Contact our controls engineering team today:
- Phone: (630) 553-0411
- Email: info@empoweredautomation.com
- Address: 1905 Marketview Dr., Suite 138, Yorkville, IL 60560
Frequently Asked Questions
Can a line have more than one bottleneck at the same time?
No. By mathematical definition, at any single instant in time, only one process is strictly limiting the maximum throughput of the total line. However, the bottleneck can shift dynamically between different machines throughout a shift due to mechanical instability, buffer exhaustion, or recipe changeovers.
How do accumulation buffers impact bottleneck analysis?
Accumulation buffers decouple adjacent machines, allowing an upstream machine to keep running while a downstream machine experiences a brief stop. While critical for maintaining line flow, unmonitored buffers can mask bottlenecks by delaying the visual impact of a failure. Buffers must be instrumented to track fill percentages in your SCADA system to verify whether they are stabilizing the line or simply hiding chronic machine stops.
How does OEE relate to bottleneck analysis?
Overall Equipment Effectiveness (OEE) should be applied rigorously to your bottleneck machine first. Improving the OEE of a non-bottleneck machine from 60% to 80% will not increase plant shipments. However, improving the OEE of your true bottleneck machine by just 3% directly increases the total salable output of the entire line.
What is the fastest way to verify if a machine is the bottleneck?
Look at its operating context. If the machine is running continuously, its upstream accumulation is constantly full (it is never starved), and its downstream conveyor is constantly empty (it is never blocked), that machine is your primary line constraint.
You might also like