Downtime Reporting
Downtime Reporting: Moving from Clipboards to Real-Time SCADA Intelligence
Every manufacturing facility tracks downtime. In many plants, however, the process has not changed in thirty years: operators write down machine stops on paper sheets clipped to the control console, or type rough estimates into a shared spreadsheet at the end of a twelve-hour shift.
On Monday morning, plant management gathers for the weekly production meeting. Operations claims Line 1 was down for four hours due to mechanical failures. Maintenance claims the line was down for two hours because of a lack of materials from the warehouse. Quality claims the real problem was out-of-spec packaging that caused continuous machine jams. Because the underlying data is built on human memory, approximations, and subjective interpretation, the meeting dissolves into an argument over whose numbers are correct, rather than a productive discussion on how to eliminate lost time.
Accurate downtime reporting is the cornerstone of continuous improvement. If you cannot measure lost capacity with objective, timestamped precision, you cannot fix it. Here is an in-depth breakdown of why conventional downtime reporting fails, the operational costs of poor tracking, and how to modernize your reporting architecture using automated SCADA and PLC intelligence.
Mistake #1: Relying on the 15-Minute Shift-End Memory Dump
Why it happens: Operators are hired to run machines, pack products, and hit output quotas—not to act as administrative clerks. During a chaotic shift with multiple small jams, material splices, and minor mechanical stops, an operator's primary objective is getting the line moving again. Logging the exact time a stoppage began and ended is postponed until the final 15 minutes of the shift.
What it costs: Human memory heavily distorts reality. A technician will remember a stressful 12-minute jam as a 30-minute disaster, while ten separate 2-minute micro-stops are forgotten entirely. The resulting downtime logs are rounded to the nearest 15-minute or half-hour increment. This creates artificial data spikes in your reporting, obscuring the true operational tempo of your equipment.
The fix: Automate machine state tracking directly at the PLC processor level. The PLC always knows when a machine is running, when it is idling, and when it is faulted. By utilizing automated device connectors and SCADA platforms, every single transition of state is logged with millisecond accuracy the exact moment it occurs, completely removing the administrative burden from line operators.
Mistake #2: Unstructured, Flat Downtime Reason Codes
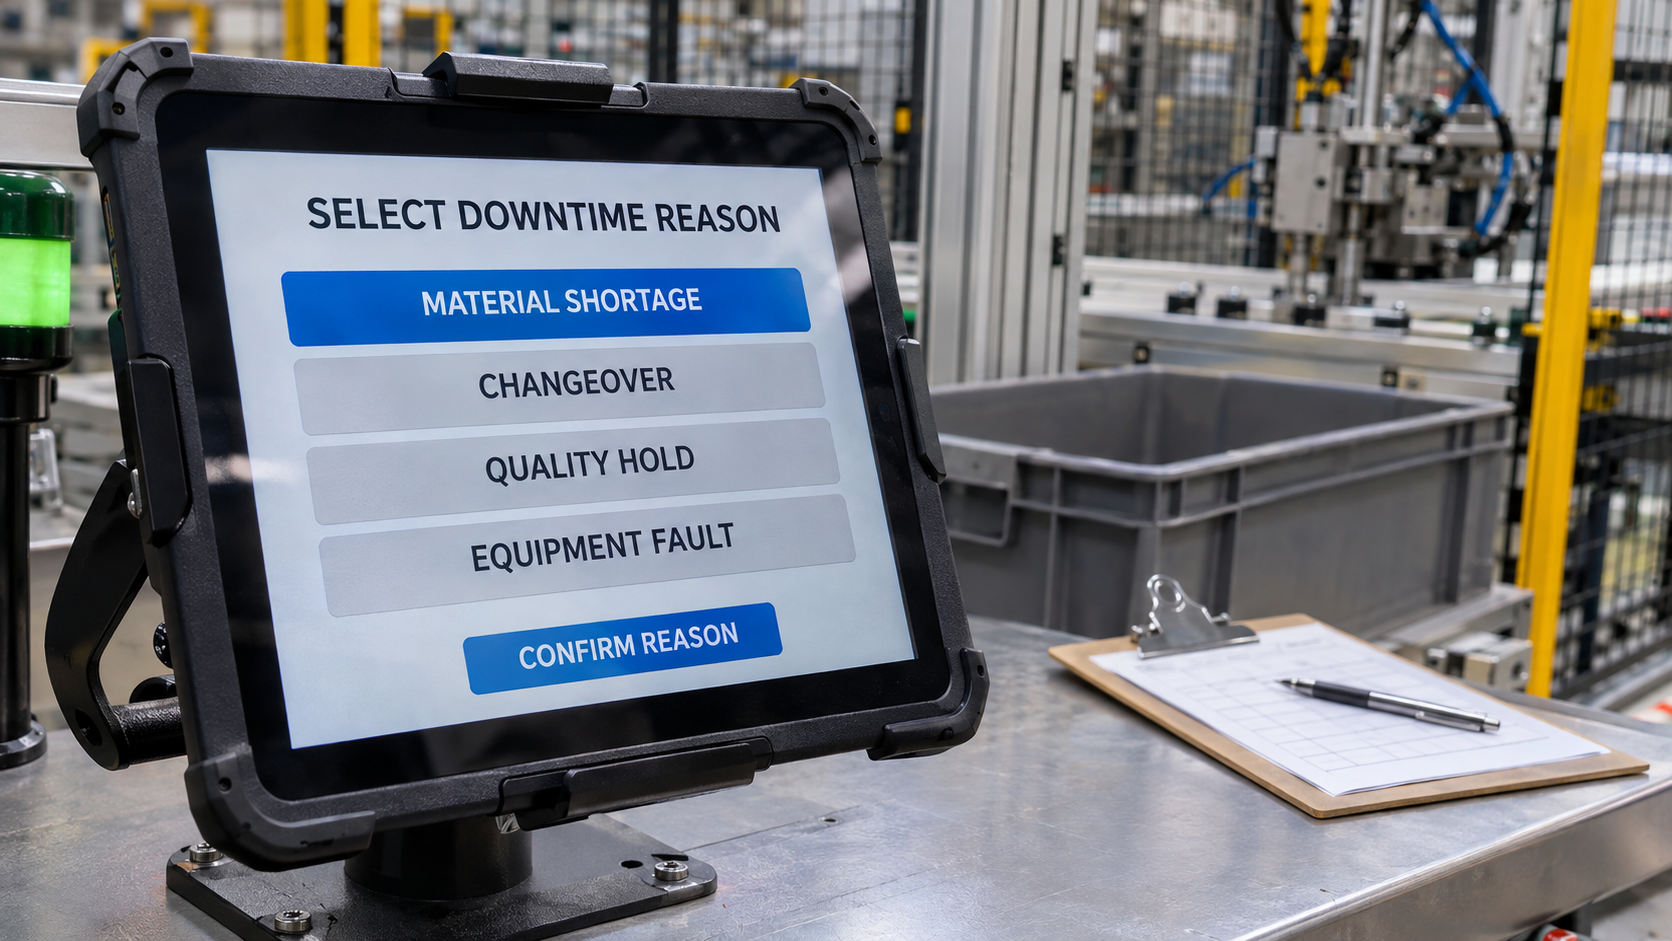
Why it happens: When plants deploy digital downtime tracking, they often make the mistake of creating a flat dropdown list containing hundreds of unorganized reason codes on the HMI. Alternatively, they provide a wide-open text field where operators can type whatever they choose.
What it costs: A flat list of 200 items overwhelms operators. In a hurry to resume production, they default to the first three options in the list, or select generic catch-alls like
General Machine Fault
or
Other
. Free-text fields produce wildly inconsistent entries ( Jam in station 2
,
Stn 2 cardboard stuck
,
Stuck box
), making it impossible for SQL databases or business intelligence tools to aggregate, group, and trend the data.
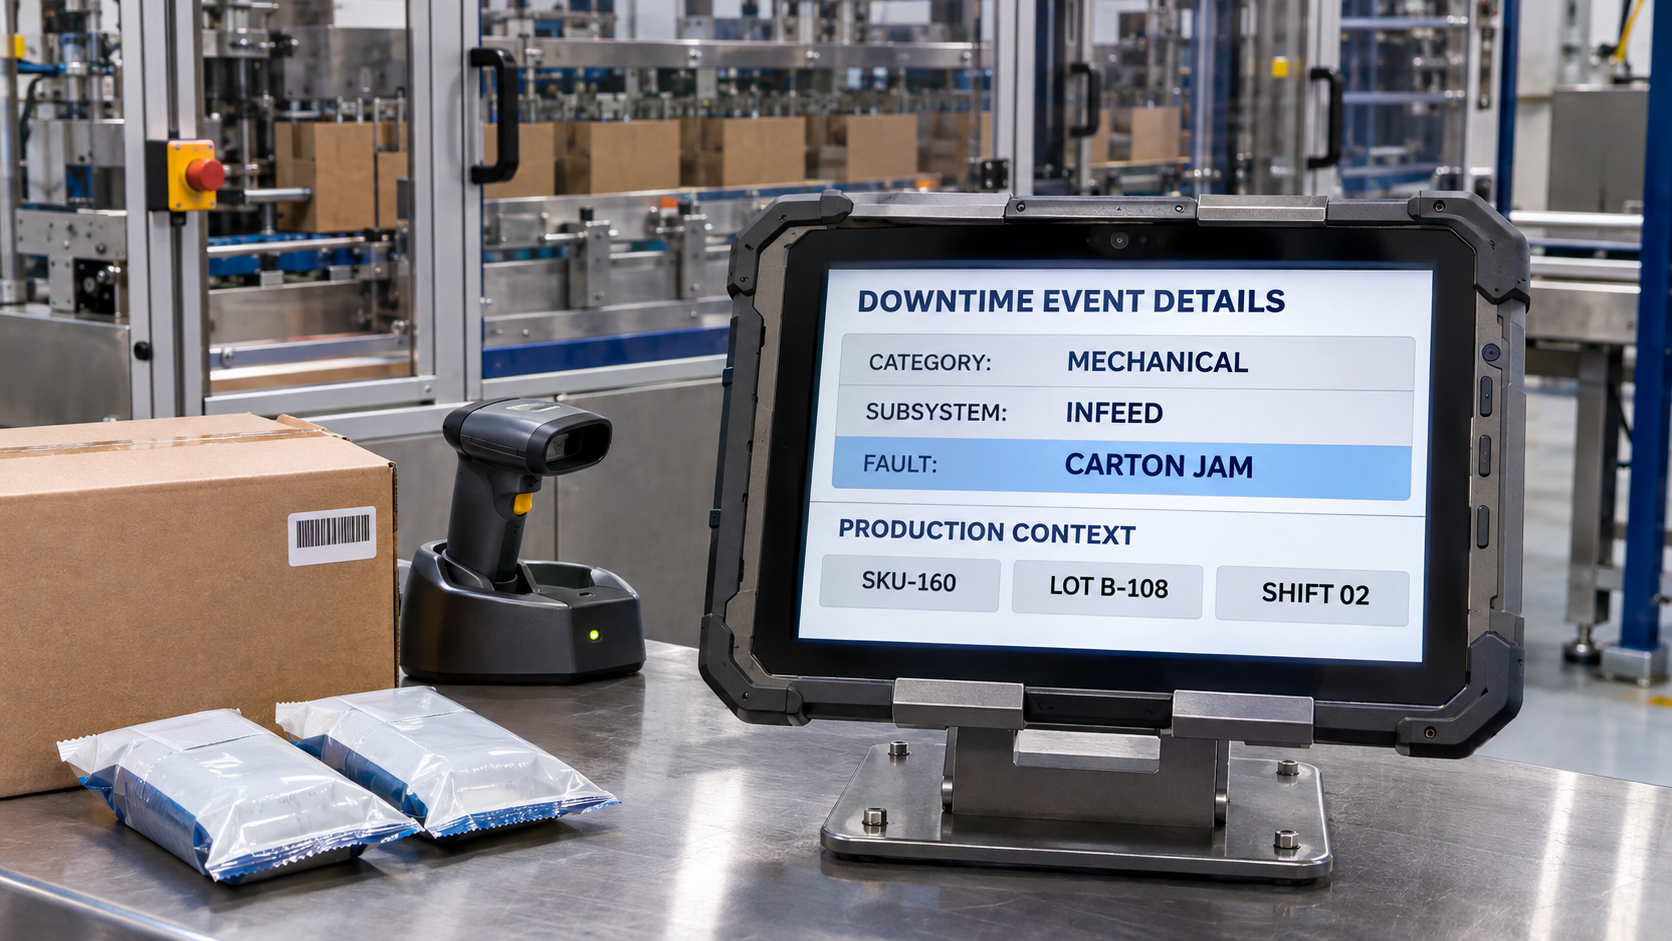
The fix: Implement a structured, hierarchical downtime taxonomy based on the OMAC PackML (Packaging Machine Language) or ISA-88/95 standards. Structure reasons in a three-tier model:
- Category: Mechanical, Electrical, Operational, Material, or Quality.
- Sub-System: Infeed Conveyor, Dosing Station, Sealer, Discharge.
- Specific Fault: Photo-Eye Blown, Thermal Overload, Low Vacuum, Jam.
Furthermore, configure your control system so that if the PLC already knows the root cause (e.g., an E-stop button was pressed, or a safety gate was opened), that code is assigned automatically without requiring human confirmation. Operator input should be reserved strictly for external issues the PLC cannot detect autonomously, such as waiting for raw materials or operator breaks.
Mistake #3: Treating "Idle" Time as "Running" Time
Why it happens: Basic downtime tracking systems operate on a binary logic: either the machine is in an active fault state, or it is considered "running." If an operator stops feeding parts into the machine, or if a downstream conveyor backs up and pauses the station, the machine does not generate a formal alarm fault bit—it simply sits idle.
What it costs: Hundreds of production hours are lost every month to machine starvation (waiting for product) and machine blockage (blocked by downstream equipment). Because no alarm was triggered, traditional reporting logs this time as full production capacity. When actual output fails to match expected throughput, management wrongly assumes the machine is running slower than rated, confusing an Availability problem with a Performance problem.
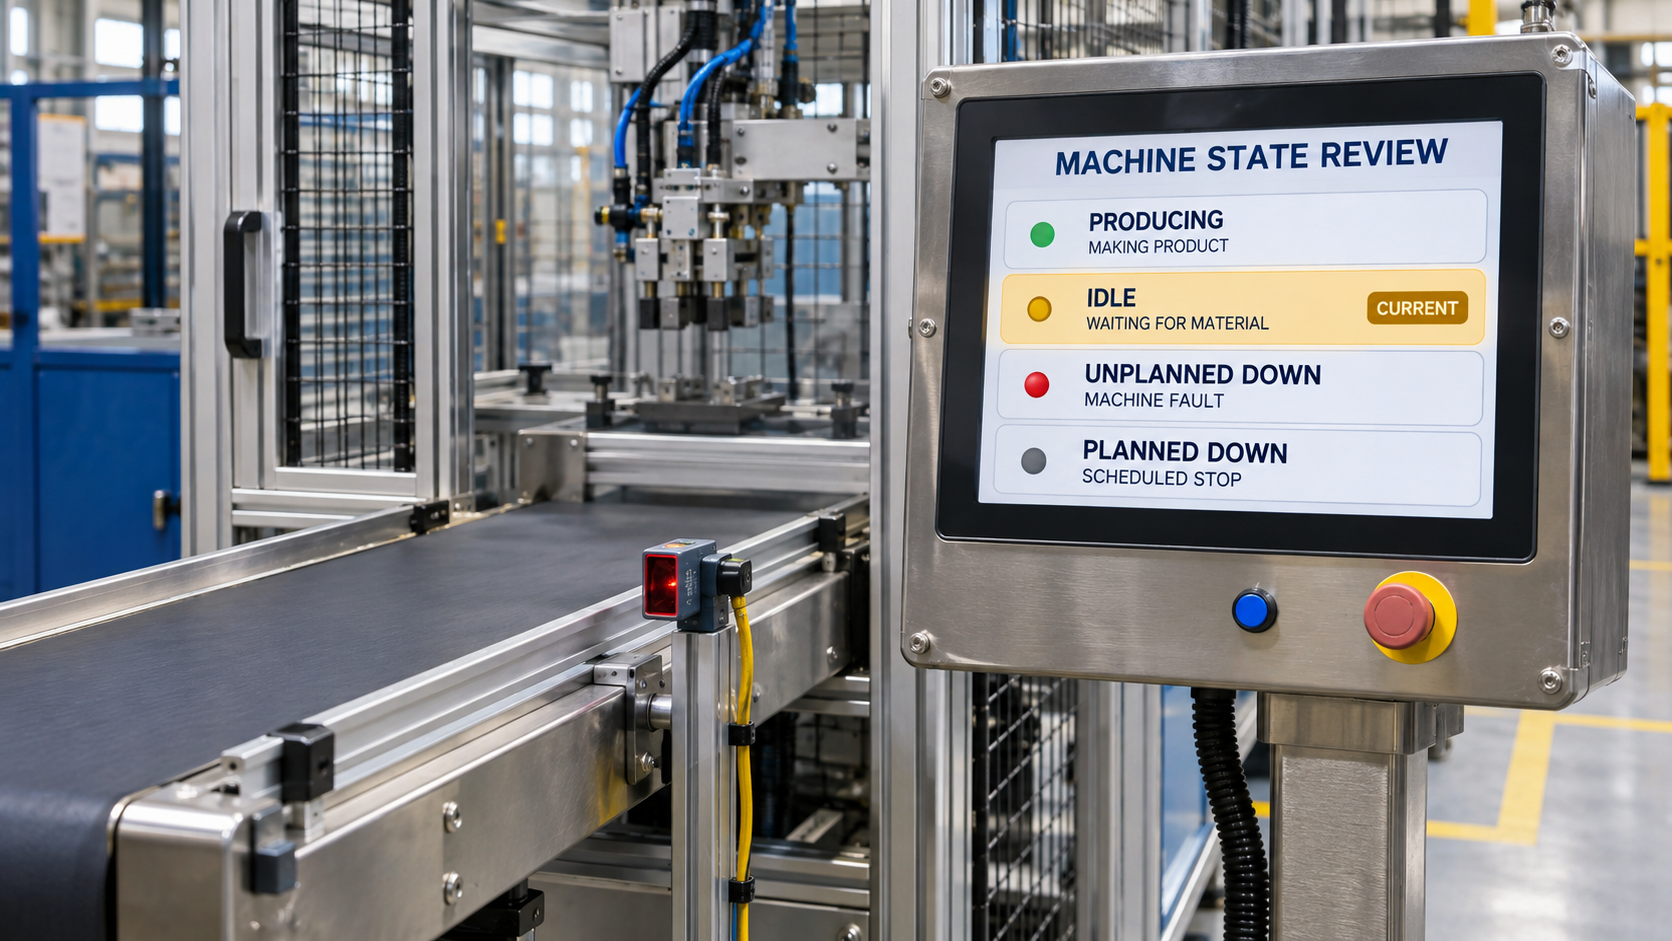
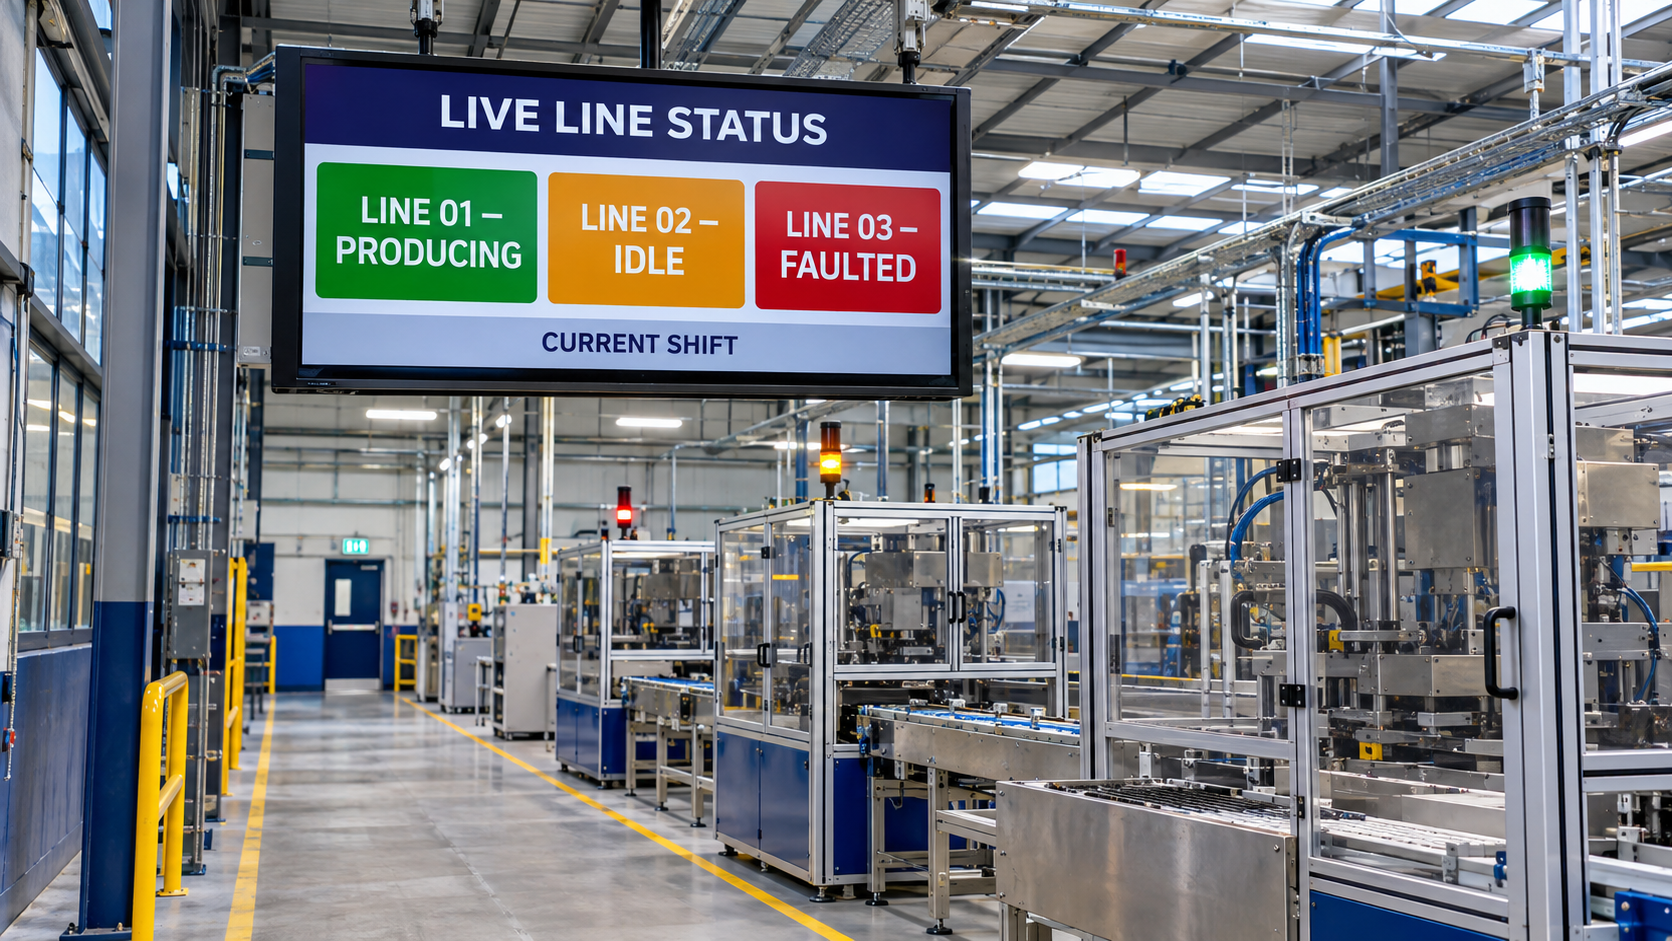
The fix: Program comprehensive machine state tracking into the PLC logic. Standardize states into:
- Producing: Running at rated speed, creating good product.
- Standby/Idle: Ready to produce, but starved of upstream product or blocked by downstream buildup.
- Unplanned Downtime: Machine faulted or stopped unexpectedly.
- Planned Downtime: Changeover, washdown, scheduled maintenance.
Tracking idle states independently from faulted states allows management to see whether lost capacity is caused by the machine itself, or by poor line balancing across upstream and downstream processes.
Mistake #4: Isolating Downtime Reports from Production Context
Why it happens: Downtime is recorded as isolated blocks of time without linking each event to the operational context: what specific product recipe was running, what raw material lot was loaded, or which operating crew was on shift.
What it costs: Engineers cannot identify systemic operational patterns. A cartoner might run flawlessly when packaging 12-ounce boxes, but experience severe, repetitive downtime whenever a specific 16-ounce SKU is introduced. If downtime logs do not capture the running SKU or material supplier lot, you will spend months chasing mechanical problems on a machine when the true root cause is out-of-spec cardboard packaging from a third-party vendor.
The fix: Use SCADA and MES integration to wrap every downtime event in rich operational metadata. Whenever a downtime event is logged, the data historian should record the active SKU, current target line speed, active recipe setpoints, environmental conditions (ambient temperature, humidity), batch/lot numbers, and operator shift ID. This turns a basic downtime log into a multi-dimensional analytics database.
Mistake #5: Publishing Reports Days After the Shift Has Ended
Why it happens: In many operations, raw downtime records are gathered weekly, scrubbed by a continuous improvement engineer in Excel, and compiled into a slide deck presented at a Monday morning management meeting.
What it costs: Latency destroys the utility of operational data. Discovering on a Friday that a thermoformer had six hours of micro-stops on Tuesday is completely useless for real-time plant floor management. The shift has ended, the material lot is gone, the operators are off-duty, and the opportunity to intervene has passed.
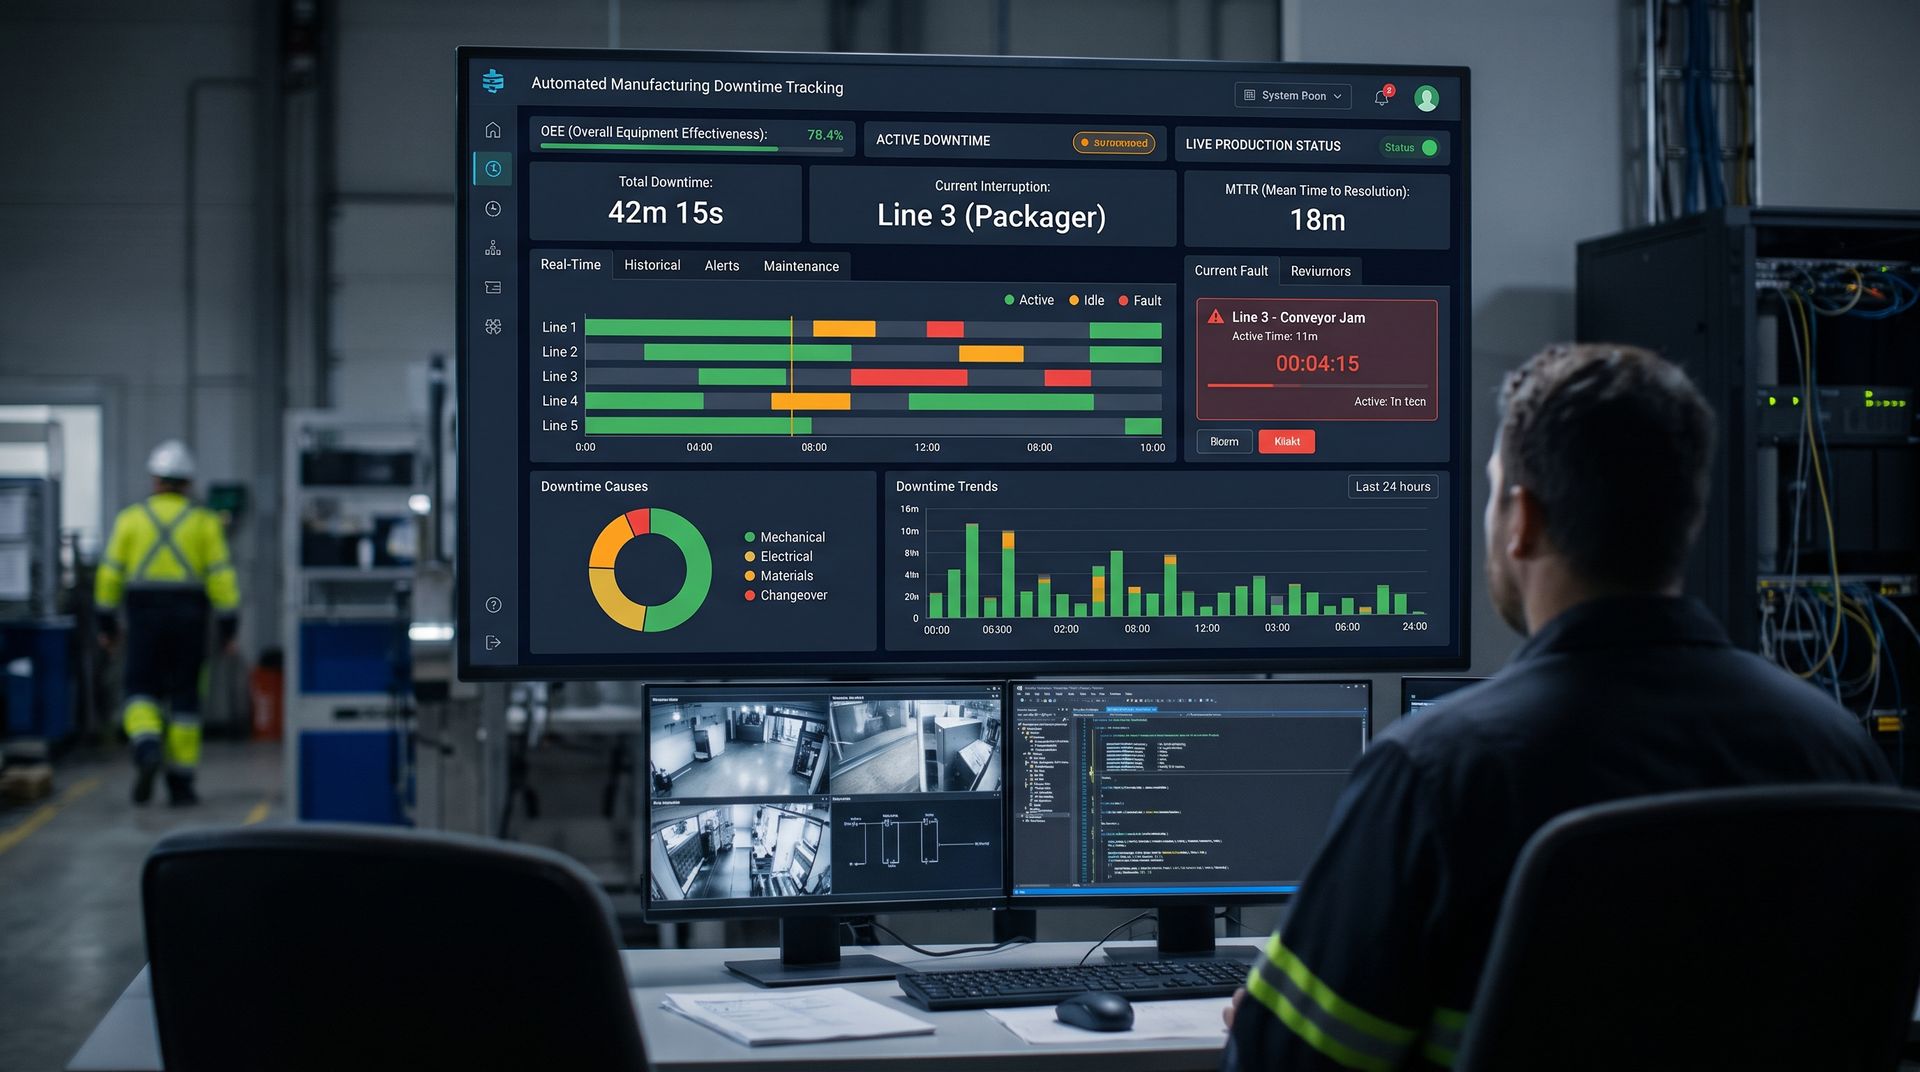
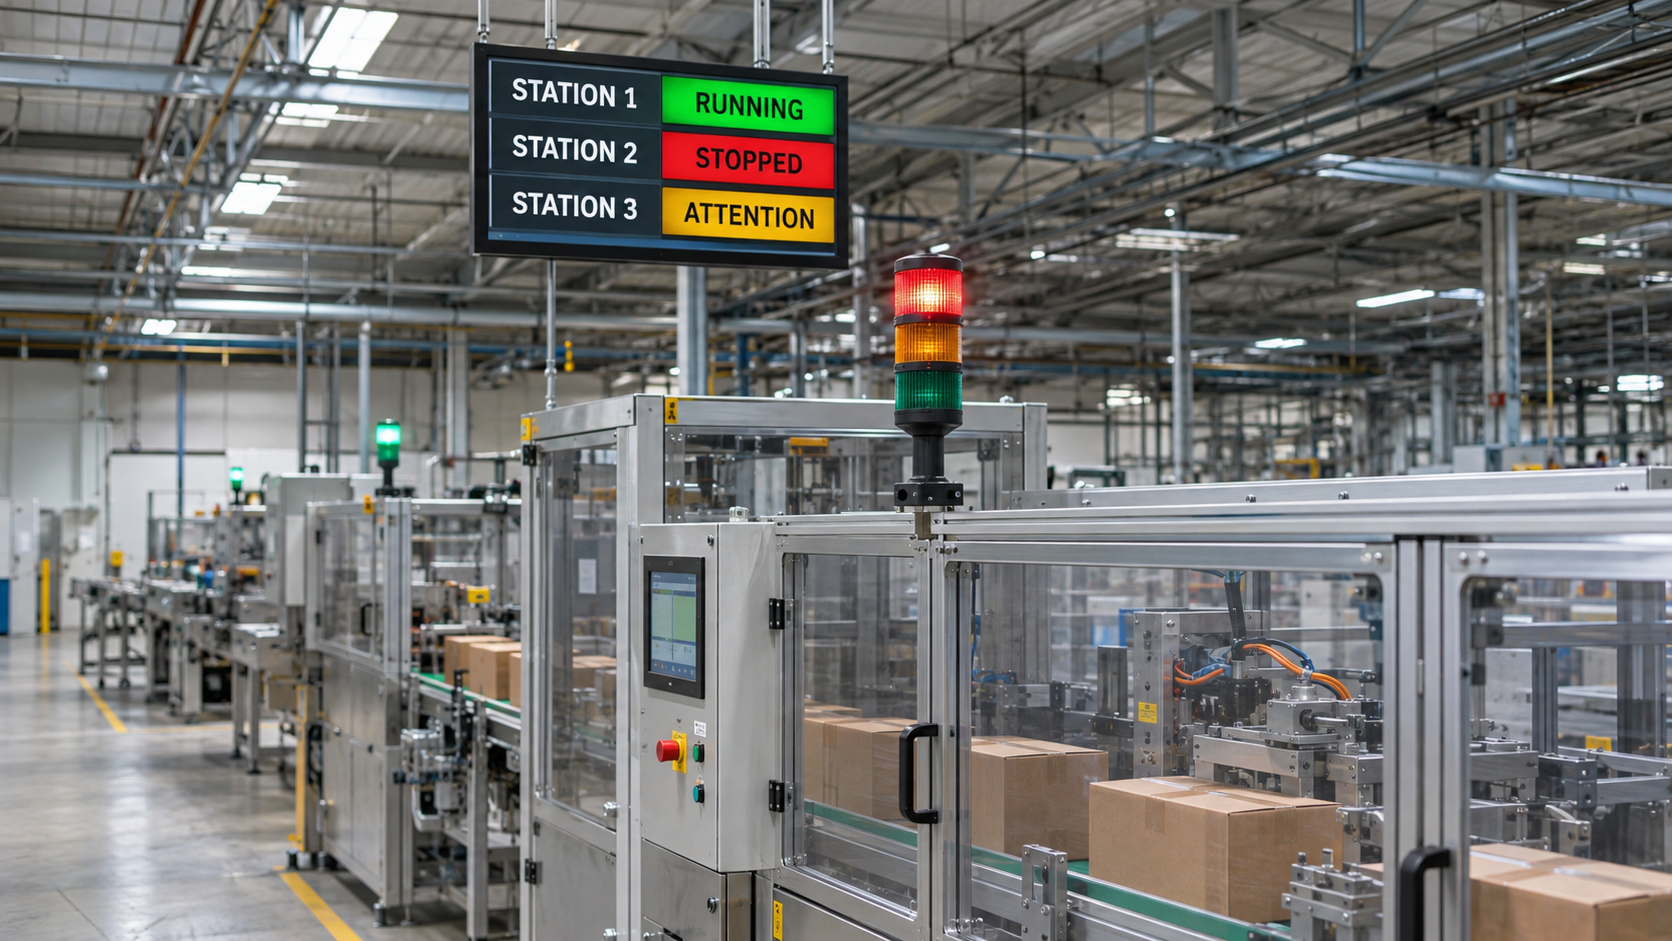
The fix: Transition from retrospective static reports to live, dynamic visualization tools. Empowered Automation deploys real-time SCADA dashboards on overhead plant-floor displays and mobile devices. Plant managers, line leads, and maintenance technicians should see live downtime Pareto charts, current machine states, and shift-to-date Availability metrics update second-by-second. When a line begins slipping below target, automated alerts escalate the issue while production is still running.
Building an Automated Downtime Reporting Architecture
An enterprise-grade downtime reporting system requires three tightly integrated architectural layers:
[ Plant Floor Layer ]
PLCs (Allen-Bradley, Siemens) + Smart IO-Link Sensors
--> Captures Run/Idle/Fault states & millisecond first-out alarms.
│
▼
[ Supervisory / Historian Layer ]
SCADA (Ignition, FactoryTalk) + Time-Series Data Historian
--> Contextualizes events with SKU, batch, speed, and environmental tags.
│
▼
[ Analytics & Business Layer ]
Relational Database (SQL) + Automated Reporting / ERP Integration
--> Generates real-time Pareto charts, OEE dashboards, and automated email summaries.
When built correctly, downtime reporting becomes an objective, background utility that operates without human friction.
Downtime Reporting Audit Checklist
Evaluate your plant’s current reporting systems against these foundational criteria:
- [ ] Automated Capture: Are machine run, idle, and faulted states triggered automatically by PLC logic rather than manual logs?
- [ ] State Separation: Can your reporting system clearly distinguish between an active mechanical breakdown and an idle state caused by starvation or blockage?
- [ ] Hierarchical Faults: Are downtime reason codes structured into standardized, tiered menus (Area $\to$ Equipment $\to$ Specific Cause)?
- [ ] Contextual Metadata: Does every logged downtime event include active SKU, batch/lot number, operator shift, and running speed?
- [ ] Real-Time Visibility: Are downtime metrics visible to operators and supervisors on live plant-floor screens, rather than locked inside weekly spreadsheets?
Conclusion
If your plant’s daily or weekly production meetings still revolve around debating whose spreadsheet numbers are accurate, your reporting system is broken. Modern manufacturing moves too quickly to rely on shift-end memory dumps and manual clipboards.
By capturing machine states directly from the PLC, standardizing your fault taxonomies, and linking downtime to operational context within a centralized SCADA and Data Historian platform, you transform downtime reporting from an administrative chore into a high-leverage continuous improvement engine.
Ready to Upgrade Your Downtime Reporting?
Empowered Automation Solutions designs and implements turnkey industrial reporting architectures. From custom PLC and HMI programming that tracks precise machine states, to SCADA platforms and Data Historians that deliver automated shift reports and live Pareto dashboards, we eliminate the blind spots on your factory floor.
Let us help you build a single source of truth for your manufacturing operations:
- Phone: (630) 553-0411
- Email: info@empoweredautomation.com
- Address: 1905 Marketview Dr., Suite 138, Yorkville, IL 60560
Frequently Asked Questions
How do we handle downtime reporting for legacy machines with no PLC?
You do not need to replace the entire machine. Empowered Automation integrates edge I/O modules, smart optical sensors, and IoT device connectors directly to the machine's motor contactors, stack lights, or cycle switches. This allows legacy equipment to report basic run, idle, and faulted states into the centralized SCADA system alongside modern PLCs.
Should operators be required to enter a reason for every machine stop?
No. Requiring manual entry for every 10-second stop creates severe operator fatigue and leads to junk data. Best practice is to have the PLC capture the exact reason automatically for all internal faults. For external stops (e.g., waiting for material), only prompt the operator for a reason code if the stoppage exceeds a defined threshold, typically 2 to 3 minutes.
What is the best way to categorize planned maintenance in downtime reports?
Planned maintenance should be clearly separated from unplanned mechanical or electrical downtime in your database. When a machine is taken down for a scheduled PM, the operator or technician should set the machine state to "Scheduled Maintenance" via the HMI. This ensures the lost time is factored into Planned Downtime, keeping your MTTR and unscheduled downtime metrics accurate.
How does automated downtime reporting improve OEE calculations?
Overall Equipment Effectiveness requires exact figures for Availability, Performance, and Quality. Manual reporting inevitably blends speed losses (Performance) with micro-stops (Availability). Automated reporting logs the precise seconds a machine was stopped versus running slowly, delivering mathematically flawless OEE scores that can be trusted across departments.
You might also like