Downtime Pareto Analysis
How to Use Downtime Pareto Analysis to Maximize Plant Output
The 80/20 rule—the Pareto Principle—states that 80% of your problems come from 20% of your causes. In manufacturing, this means a massive chunk of your lost production is usually caused by just a handful of recurring faults.
A Downtime Pareto Analysis visually charts these faults, ranking them from the largest contributor of downtime to the smallest. It is the most powerful tool an operations manager has for directing capital and maintenance efforts. Yet, many plants try to run Pareto reports and get useless data. If you’re evaluating your reporting structure or looking to upgrade your SCADA to provide better business intelligence, here are the most common mistakes plants make with Pareto analysis and how to fix them.
Mistake #1: The "Miscellaneous" Category is Your Biggest Bar
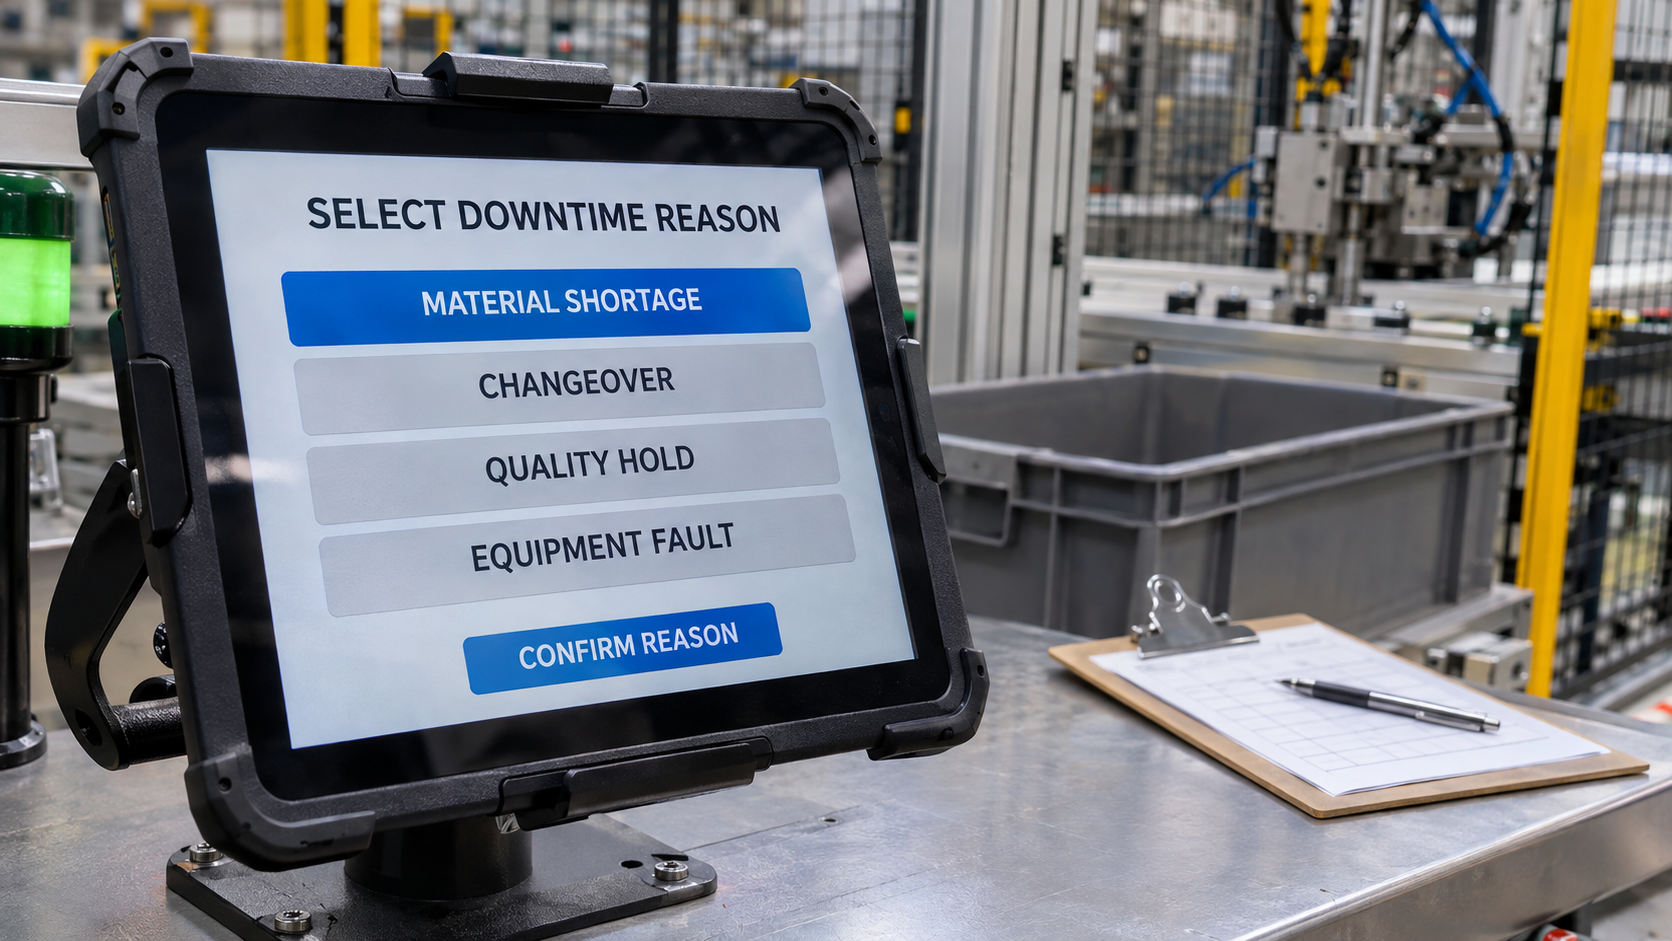
Why it happens: Operators are required to select a downtime reason from a dropdown menu on an HMI. When they are in a rush to get the machine running, they select "Other," "Unknown," or "Miscellaneous" just to clear the screen.What it costs: When "Unknown" is the biggest bar on your Pareto chart, the analysis is useless. Engineering cannot troubleshoot an unknown problem, and management won't approve funding to fix a "miscellaneous" issue.The fix: Tie fault codes directly to PLC logic. If a VFD faults, the PLC knows exactly why the machine stopped. The SCADA system should automatically log that specific VFD fault into the database without requiring operator input. Reserve operator input only for external issues (e.g., "Waiting on Materials").
Mistake #2: Chasing Occasional Disasters Instead of Chronic Micro-Stops
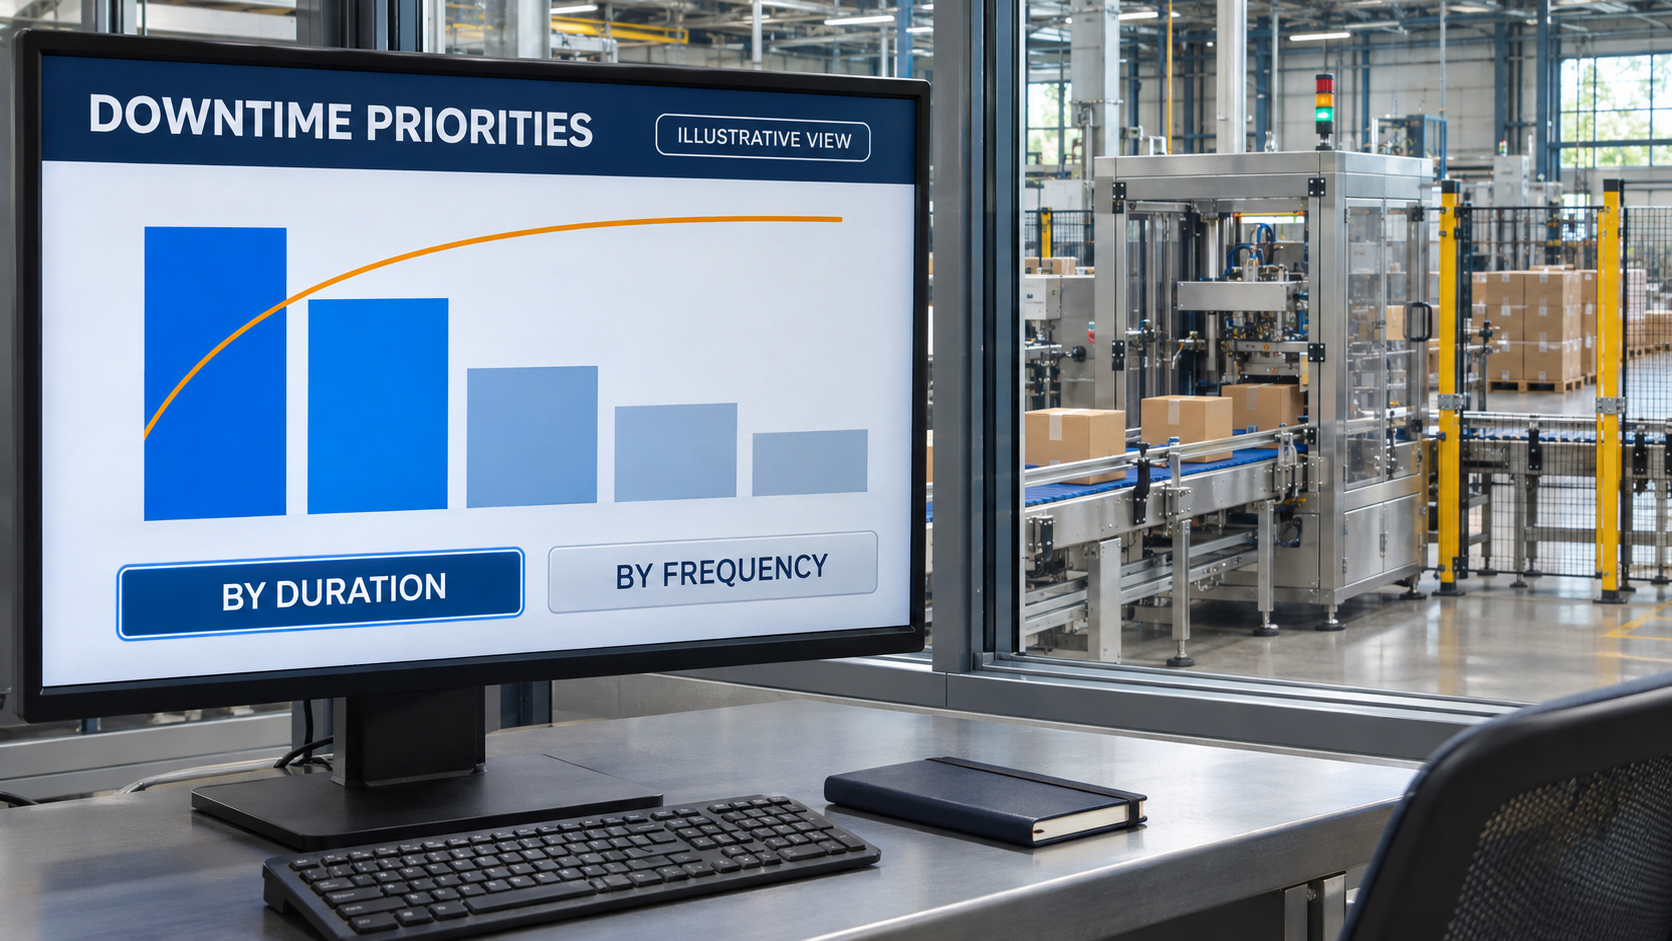
Why it happens: A main drive shaft snaps, taking a line down for 12 hours. At the end of the month, that 12-hour event dominates the Pareto chart. The engineering team focuses entirely on the drive shaft.What it costs: The drive shaft was a freak accident that might not happen again for a decade. Meanwhile, a case erector that jams for 3 minutes, 20 times a shift, is quietly stealing 30 hours of production time a month. Focusing on the freak accident leaves the chronic daily bleed unchecked.The fix: Generate two Pareto charts: one by Duration of downtime, and one by Frequency of downtime. HMI/SCADA and Data Historian tools easily auto-generate both. Fixing a high-frequency micro-stop often yields a much faster ROI than trying to engineer away a once-in-a-lifetime breakdown.
Mistake #3: Too Many Root Cause Categories
Why it happens: In an attempt to be thorough, an engineer creates a database of 400 different downtime reason codes.What it costs: Data fragmentation. When faults are spread across 400 highly specific categories, the Pareto bars all look flat. The "vital few" problems don't stand out because they’ve been diluted.The fix: Use a tiered fault structure in your SCADA reporting. Level 1 (Area): Packaging. Level 2 (Machine): Case Packer. Level 3 (Specific Fault): Flap jam. A good Systems Integration partner can map your PLC arrays to a relational database so you can drill down from broad categories to specific sensors.
Mistake #4: Disconnected Data Silos
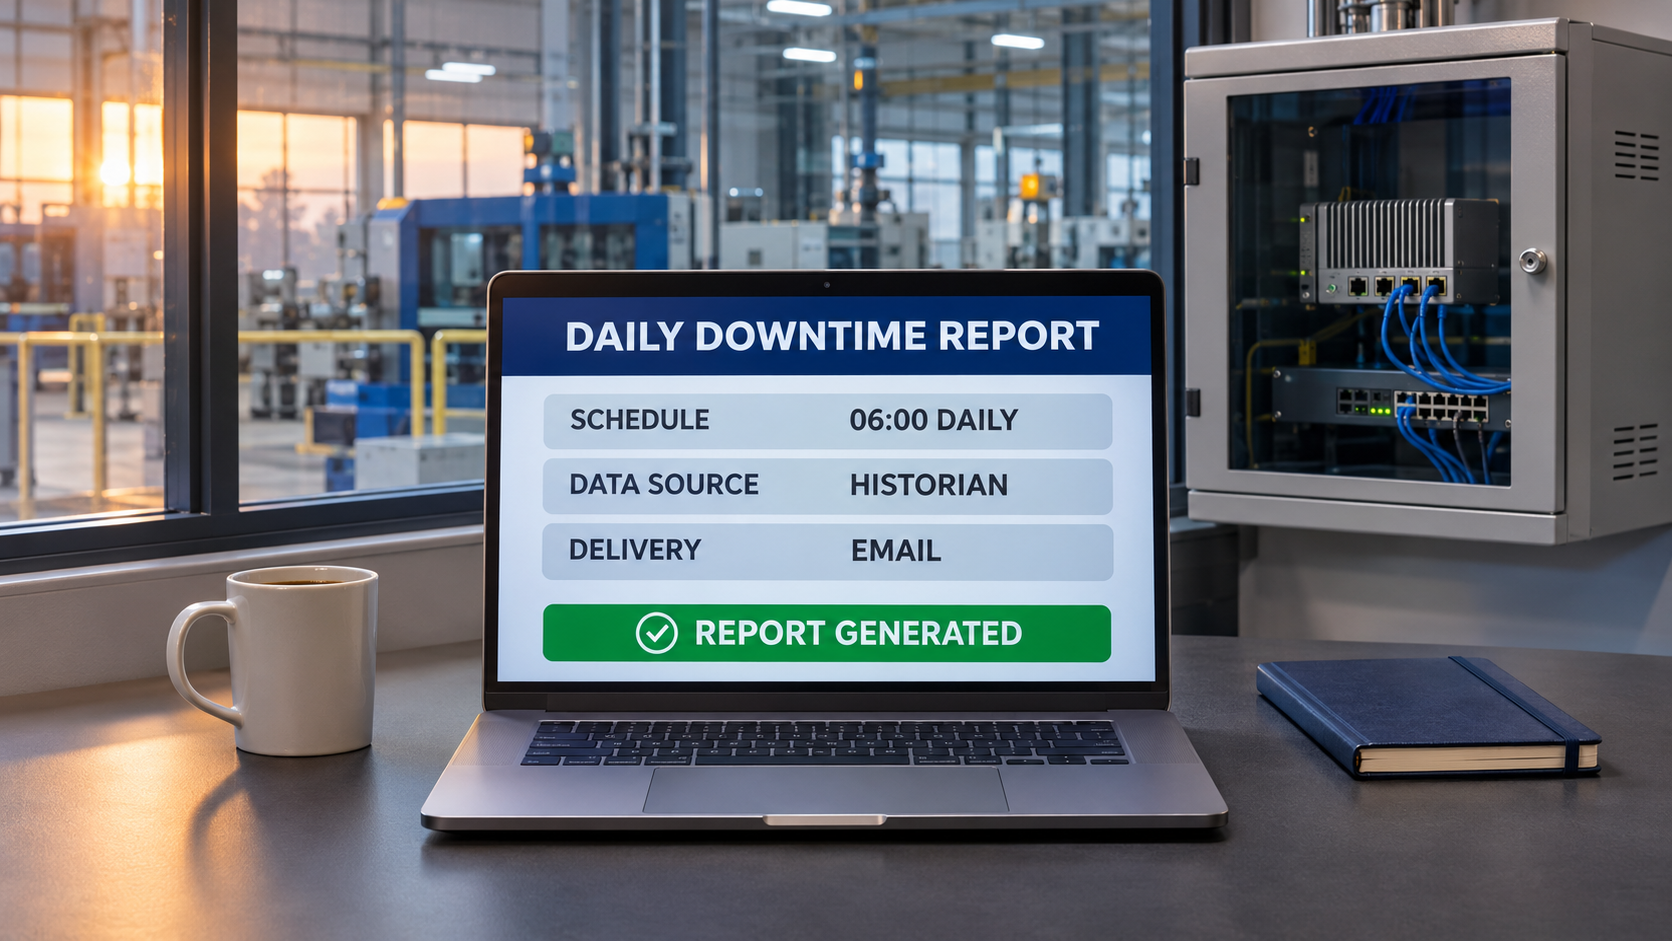
Why it happens: The downtime data lives in an Excel sheet, the production counts live in the ERP, and the machine speeds live in the PLC.What it costs: Building a monthly Pareto report takes an engineer 15 hours of exporting, copy-pasting, and formatting. By the time the report is presented, the data is three weeks old and operations has already moved on.The fix: Implement an industrial intelligence platform via automated Data Connectors and Developer Tool APIs. Empowered Automation configures automatic reporting where Ignition or other SCADA platforms query the SQL database and email a fresh, interactive Pareto PDF to plant managers every morning at 6 AM.
Using Visualization and KPIs to Spot Trends
Once retrieval is reliable, data visualization turns raw history into decisions. Reviewing a daily Pareto chart allows maintenance to tackle yesterday's biggest offender today. If a new bar suddenly spikes on the chart, it might indicate a sensor drifted or a mechanical part is wearing out.
Quick Audit Checklist for Pareto Analysis
- Ensure your top downtime reason is never "Other" or "Unknown."
- Verify your reporting system tracks both downtime duration and frequency.
- Confirm data is being automatically logged from the PLC to prevent operator bias.
- Automate your report generation so engineers spend time fixing problems, not formatting Excel.

Conclusion
A Pareto chart is only as good as the data beneath it. The most common mistakes are the predictable results of relying on manual entry or poorly structured fault codes. By leveraging proper PLC and HMI programming, you can automate your data collection and let the systems tell you exactly where your plant is bleeding efficiency.
Ready to Automate Your Downtime Tracking?
Empowered Automation Solutions specializes in Systems Integration, connecting the factory floor to the boardroom. We build customized HMI, SCADA, and automated reporting systems that give you crystal-clear visibility into your downtime. Contact us today at (630) 553-0411 or email info@empoweredautomation.com to stop guessing and start improving.
Frequently Asked Questions
What is the 80/20 rule in manufacturing downtime? It is the observation that roughly 80% of total plant downtime is usually caused by 20% of the possible failure modes. Finding and fixing those specific failure modes yields massive efficiency gains.
How do I track micro-stops in a Pareto chart? Micro-stops (downtime under 1-3 minutes) must be tracked automatically via the PLC and SCADA system. Operators physically cannot log them accurately by hand.
Can I run a Pareto chart directly from a Data Historian? Yes. Modern Data Historians and SCADA platforms have built-in visualization tools to query time-series and event data, outputting dynamic Pareto charts on plant-floor dashboards in real-time.
You might also like