Root Cause Analysis for Repeat Downtime
Root Cause Analysis for Repeat Downtime: How to Break the Reactive Maintenance Cycle
Every controls engineer and maintenance manager knows the frustration of the "chronic" failure. It is the packaging line wrapper that trips on an infeed jam twice per shift, the servo drive that faults on overcurrent every Tuesday at 2:00 AM, or the pneumatic transfer arm that mysteriously hesitates only during high-humidity days.
In most plants, the immediate response is reactive: the operator clears the jam and resets the fault on the HMI; the maintenance technician power-cycles the drive or adjusts a proximity sensor with a wrench; production resumes. On paper, the repair took less than five minutes. But when that same fault recurs 40 times over the course of a month, those five-minute interruptions aggregate into dozens of hours of lost production, burned labor, and persistent schedule slippage.
Root Cause Analysis (RCA) is the formal discipline of diagnosing the true physical, human, or systemic origin of a failure so it never happens again. Yet, the vast majority of industrial RCA initiatives fail—not because plant personnel lack troubleshooting skills, but because the plant's automation and data infrastructure is not configured to capture the evidence required to isolate the failure.
If your facility is stuck in a loop of band-aid fixes and repeat downtime, here are the most critical mistakes plants make during Root Cause Analysis, and the automation solutions required to fix them permanently.
Mistake #1: Confusing the "First Alarm" with the "Root Cause"
Why it happens: When a line trips, technicians look at the HMI alarm banner to see what caused the stop. If the alarm reads
PE-402 Infeed Jam
, the immediate assumption is that the photo-eye is misaligned or defective. The team cleans or replaces the sensor, resets the machine, and considers the problem solved.
What it costs: The sensor trip is rarely the root cause; it is merely the symptom that triggered the safety or interlock circuit. The real issue might be upstream conveyor slip caused by a loose drive belt, an inconsistent air supply to an upstream pneumatic diverter, or thermal expansion warping a guide rail over a six-hour run. By treating the symptom, the plant spends money replacing perfectly functional hardware while the underlying defect remains untouched.
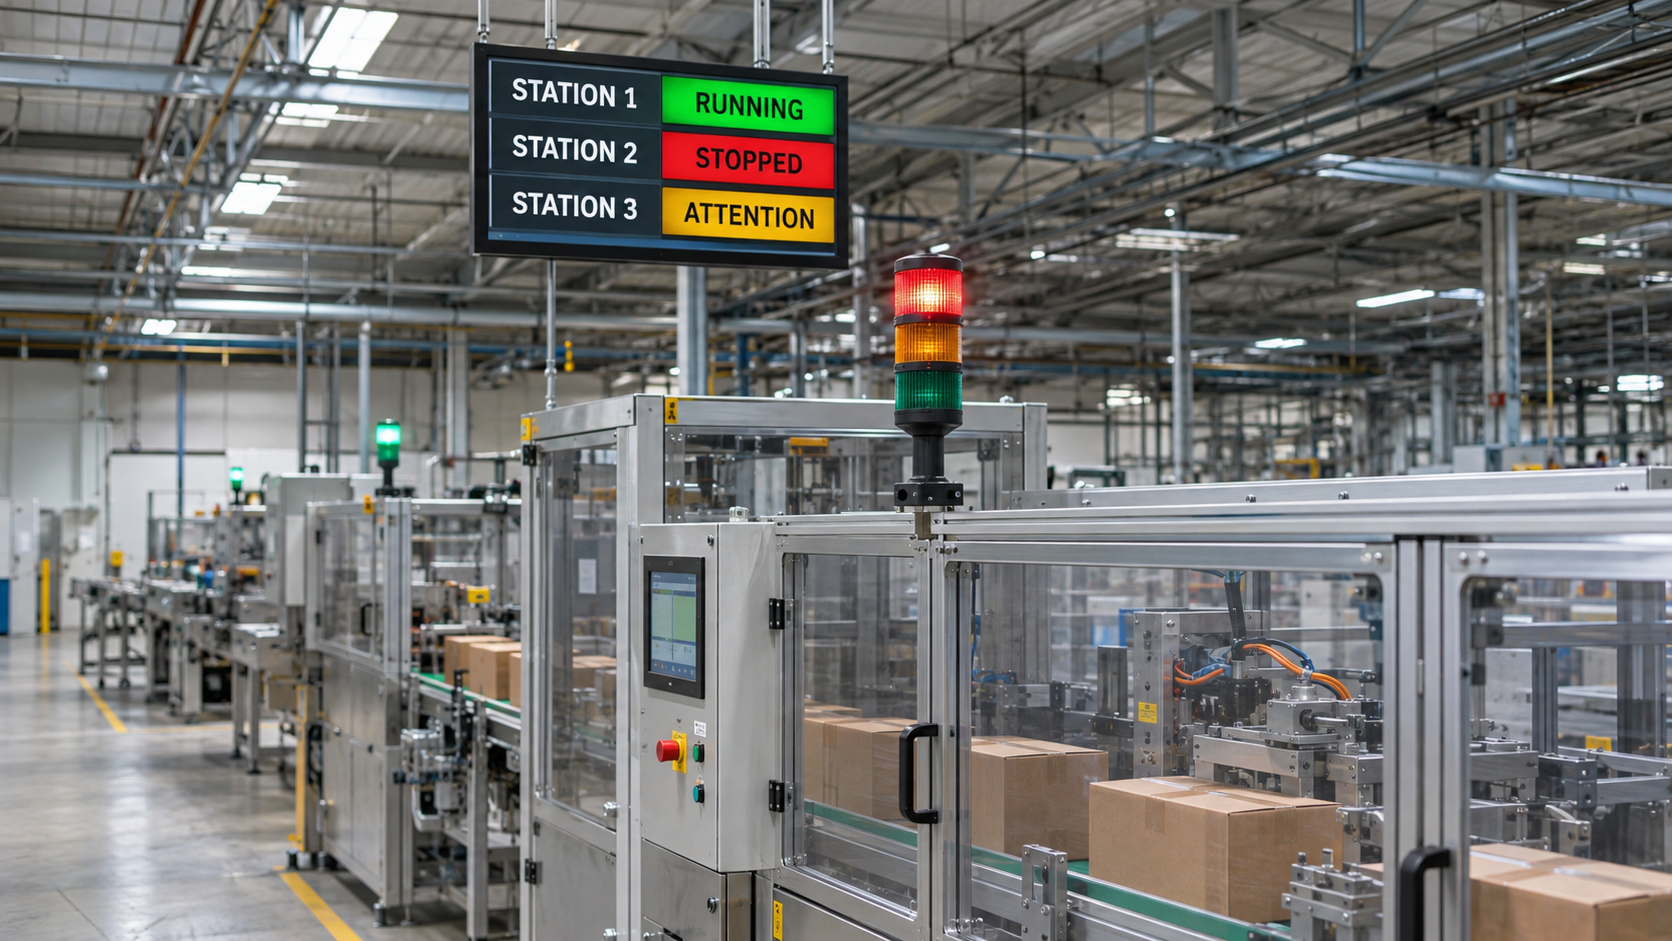
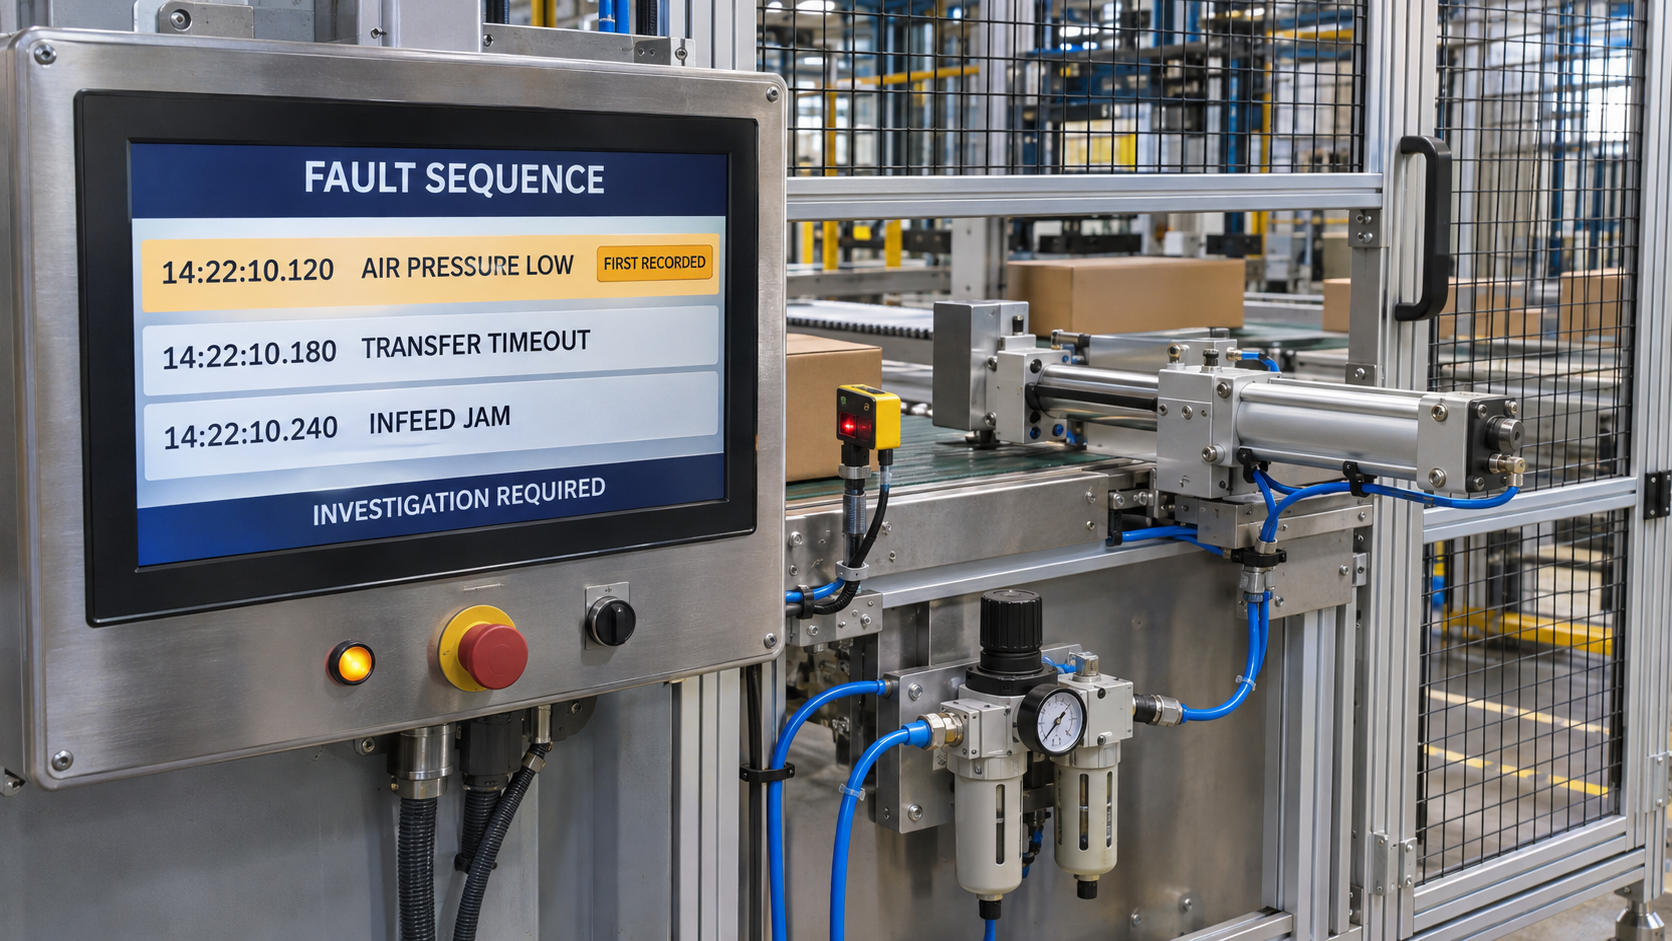
The fix: Implement "First-Out" alarming and sequence-of-events logging inside the PLC ladder logic. A properly architected PLC program records the precise millisecond each interlock opens. Rather than presenting operators with a cascade of 15 simultaneous alarms, the HMI should explicitly highlight the root initiating event versus secondary derivative faults. Pair this with a standard "5 Whys" methodology backed by actual tag data from your SCADA system to trace the failure back to its mechanical, electrical, or operational source.
Mistake #2: Lack of High-Speed Historian Data to Capture Pre-Fault Signatures
Why it happens: Standard SCADA setups poll PLC tags at 1-second to 5-second intervals. When a transient electrical fault, instantaneous pressure dip, or high-speed mechanical bind occurs, it often happens within a 50-to-200-millisecond window. The data historian records an average or misses the oscillation completely, showing smooth process variables right up to the moment of catastrophic failure.
What it costs: Maintenance teams are left troubleshooting in the dark. Without high-resolution data, engineers cannot determine whether an overcurrent trip was caused by an instantaneous mechanical stall, a voltage sag on the plant electrical grid, or a PID loop that began violently hunting minutes before the shutdown. The root cause gets labeled as an unexplainable "electrical glitch."
The fix: Configure event-driven, high-speed burst logging in your industrial data historian. For critical assets (extruders, high-speed fillers, main drive motors), configure the PLC to maintain a continuous, rolling ring buffer of high-speed data (10–50 ms scan rate) for motor current, DC bus voltage, hydraulic pressure, and vibration. When a fault occurs, the PLC automatically dumps the 30 seconds of pre-fault and post-fault data into the historian. This provides controls engineers with an exact diagnostic snapshot of the machine's physics leading directly to the trip.
Mistake #3: Ignoring Unsynchronized Timestamps Across Control Platforms
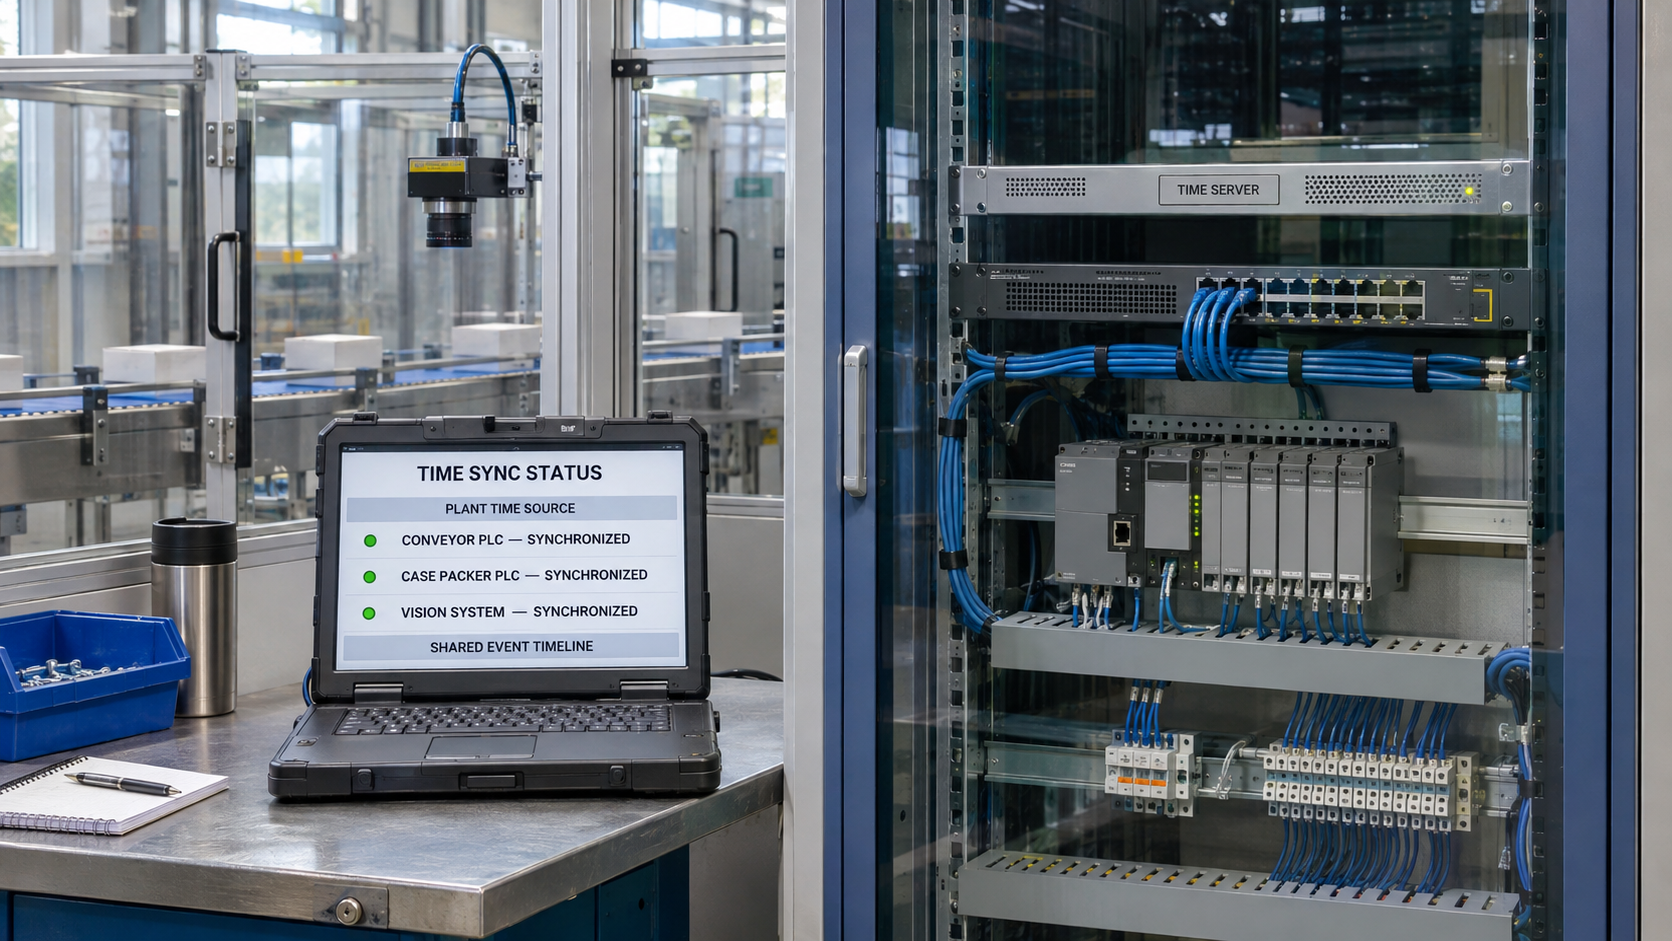
Why it happens: A modern production line rarely runs on a single controller. A single line often consists of an Allen-Bradley PLC running the line conveyors, a Siemens controller running the case packer, standalone smart drives on Ethernet/IP, and a PC-based vision system. If these devices do not share a synchronized clock, their internal event logs drift apart by seconds or even minutes.
What it costs: When attempting an RCA after a line crash, engineers pull logs from the conveyor PLC, the case packer, and the vision system. Because the timestamps disagree, it is impossible to reconstruct the chronological chain of events. Did the vision system reject the part because the conveyor stalled, or did the conveyor stall because the vision system commanded an emergency stop? Conflicting timelines destroy root cause investigations and lead to finger-pointing between equipment vendors.
The fix: Implement disciplined Network Time Protocol (NTP) or Precision Time Protocol (IEEE 1588 PTP) across the entire OT architecture. Every PLC, HMI, smart sensor, network switch, and historian collector must be locked to a master plant time server (ideally GPS-disciplined). With sub-millisecond time synchronization, engineers can stack event logs on a single unified timeline to immediately see which asset initiated the shutdown sequence.
Mistake #4: Disconnecting Maintenance Work Orders from PLC Fault History
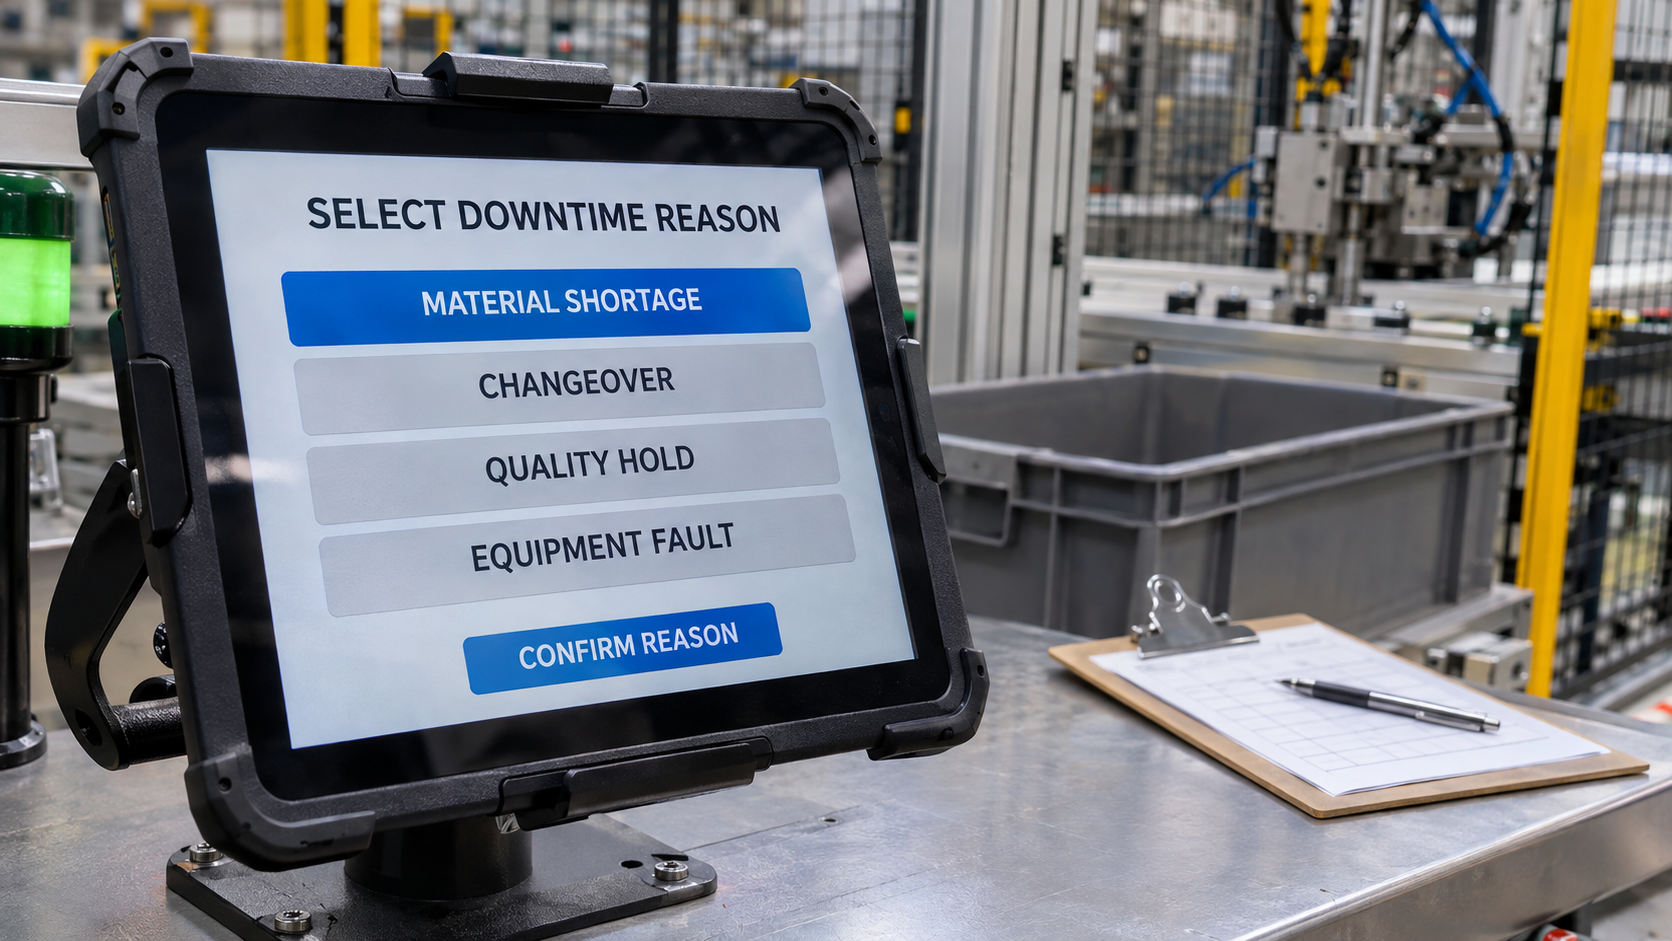
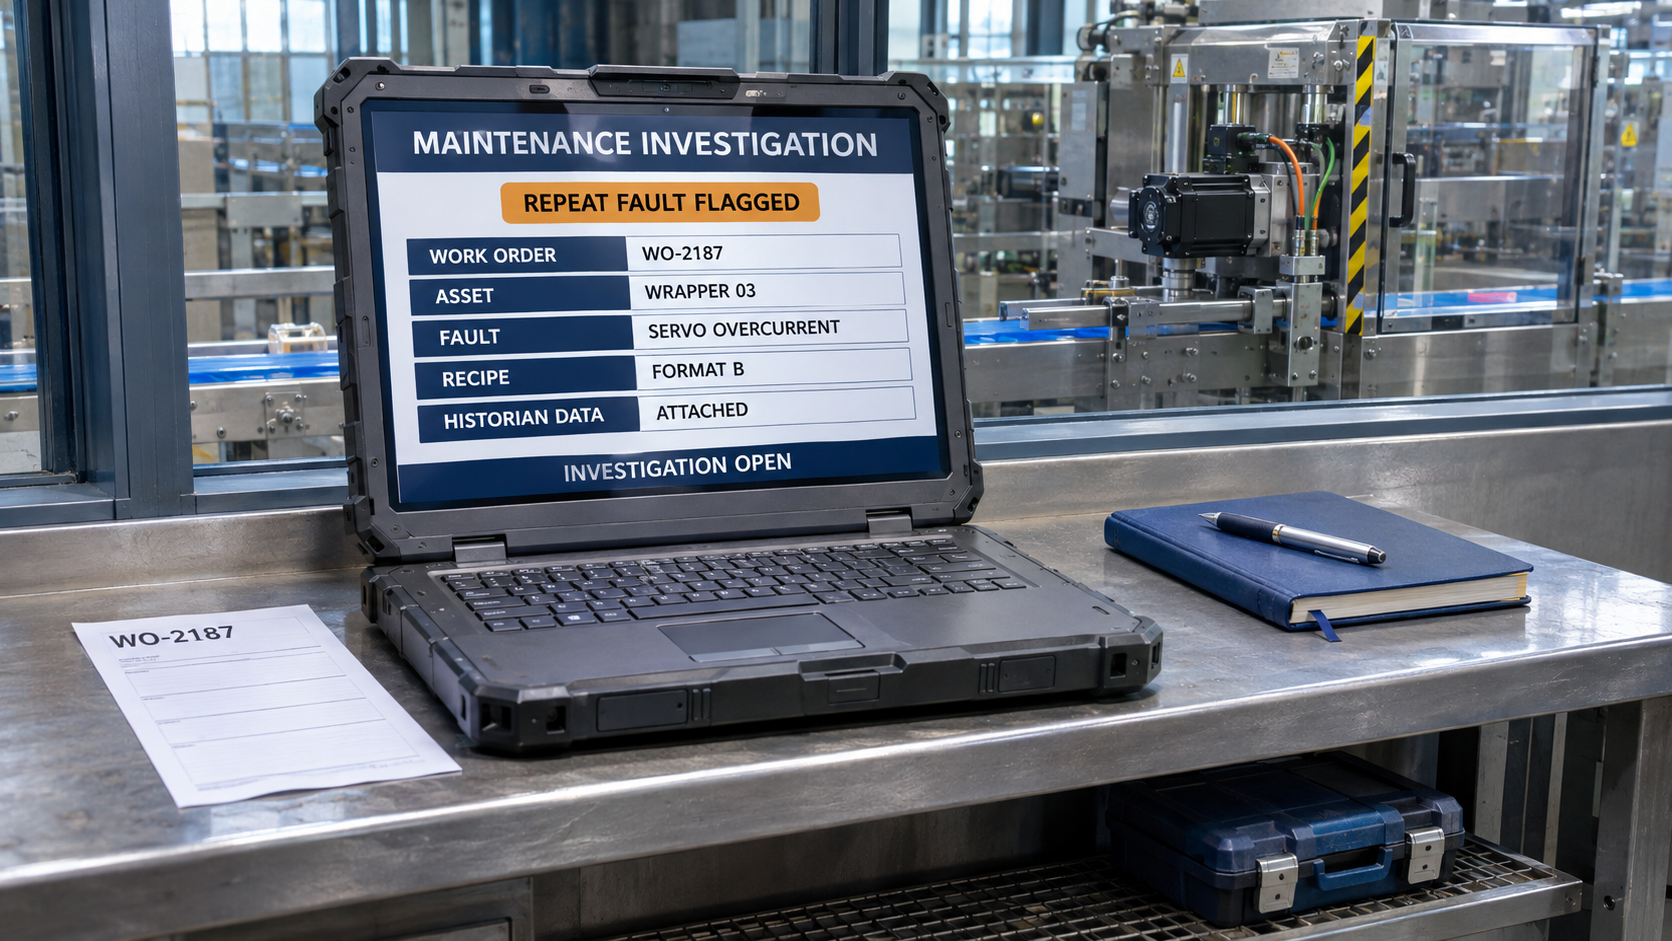
Why it happens: Maintenance work is tracked in a Computerized Maintenance Management System (CMMS), while machine faults are tracked in the PLC and SCADA system. The two systems rarely communicate. Technicians log vague descriptions into the CMMS like "fixed wrapper jam," without documenting the exact PLC fault code, the specific servo error bit, or the recipe running at the time of the failure.
What it costs: Reliability engineers cannot correlate maintenance interventions with actual machine telemetry. A motor might be replaced three times in six months because technicians assume it is defective, when in reality, the PLC code is commanding excessive torque during high-speed index cycles. Because the work orders are disconnected from the historian data, the trend goes unnoticed.
The fix: Bridge the gap between your SCADA layer and your CMMS through automated APIs and IoT connectors. When a critical machine fault exceeds a set duration threshold (e.g., more than 10 minutes), the SCADA platform should automatically generate a draft work order inside the CMMS, prepopulating it with the exact fault code, the running SKU, the motor thermal history, and the last 15 minutes of operating data. When the technician closes the work order, their notes are mapped directly back to that specific failure event.
Mistake #5: Failing to Track Micro-Stops as Precursors to Major Failures
Why it happens: Plants typically focus their RCA efforts exclusively on "major" breakdowns—outages that shut a line down for 30 minutes or more. Minor trips that last 10 to 30 seconds are cleared manually by operators and dismissed as minor operational noise.
What it costs: Catastrophic mechanical failures rarely happen without warning. A bearing does not shatter spontaneously; it binds and hesitates for weeks, generating micro-stops and thermal spikes before seizing completely. By ignoring high-frequency micro-stops, maintenance teams throw away the earliest, cheapest diagnostic indicators of impending failure.
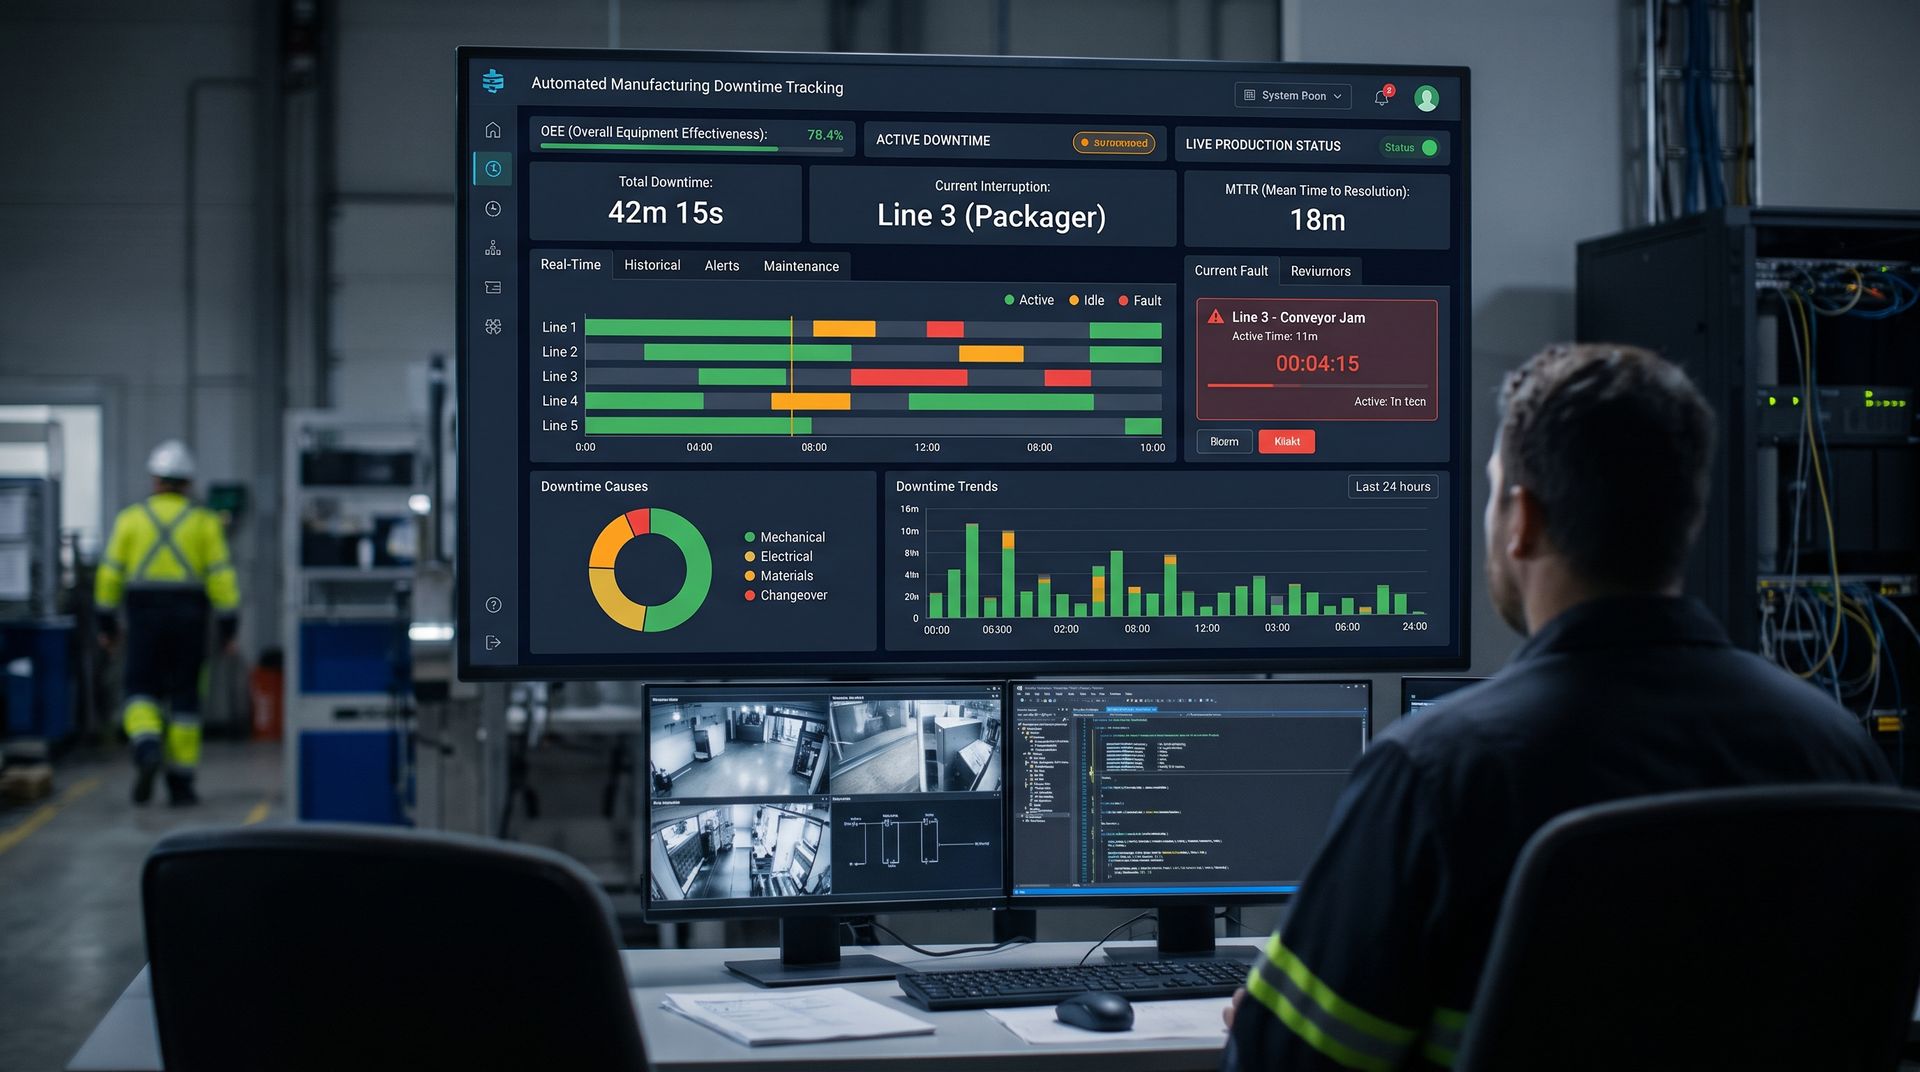
The fix: Utilize automated downtime tracking to calculate failure frequency alongside total downtime duration. A machine component that faults 25 times in a single shift for 20 seconds at a time must be flagged for an automated RCA just as aggressively as a single 30-minute stop. Empowered Automation configures SCADA visualization tools that automatically flag repeat transient faults, giving maintenance teams the opportunity to intervene before a chronic micro-stop evolves into a catastrophic breakdown.
How Automation and Analytics Transform Root Cause Analysis
Effective Root Cause Analysis is not a post-mortem paperwork exercise; it is an active engineering methodology that relies on high-fidelity operational data. When plant systems are integrated properly:
- The PLC identifies the first true deviation, eliminating human guesswork.
- The Data Historian records high-speed process variables, capturing transient spikes, thermal drifts, and mechanical binds.
- The SCADA layer visualizes the correlation between machine faults, ambient utility variations (such as compressed air drops or voltage fluctuations), and operational shifts.
By eliminating manual logging and uncoordinated event records, your engineering team can transition from an endless loop of emergency resets to structural, permanent engineering fixes.
Root Cause Analysis Audit Checklist
Before kicking off your next failure investigation, confirm your automation infrastructure has the following capabilities:
- [ ] First-Out Logic: Does your PLC ladder logic capture and latch the initial fault in an interlock chain before secondary faults cascade?
- [ ] Time Synchronization: Are all PLCs, HMIs, drives, and data collectors synchronized to a single NTP/PTP master clock within $\pm10\text{ ms}$?
- [ ] High-Speed Ring Buffering: Do your critical assets have pre-fault high-speed data capture configured for motor current, torque, and line pressure?
- [ ] Automated Work Order Context: Are CMMS maintenance logs automatically enriched with PLC fault codes and operating states?
- [ ] Transient Fault Alerts: Does your alarm management system track the frequency of short-duration micro-stops to spot mechanical wear early?
Conclusion
Repeat downtime is a symptom of incomplete data. When maintenance teams lack access to high-resolution time-series data, millisecond-accurate alarm sequences, and integrated work-order tracking, they are forced to guess. Those guesses turn into the chronic, repeating failures that drain plant capacity and inflate operational costs.
Upgrading your control architecture, standardizing your alarm logic, and deploying a modern industrial data historian provides the visibility needed to uncover the real physical root causes behind your equipment downtime.
Ready to Eliminate Repeat Downtime?
Empowered Automation Solutions helps manufacturers break out of reactive maintenance modes. Our systems integration team designs and commissions advanced PLC and HMI programming, high-resolution Data Historian systems, automated Alarm Logging & Notification tools, and seamless CMMS/SCADA integrations. Whether you need to re-architect legacy PLC alarm logic or capture high-speed event telemetry across multiple production lines, we have the engineering expertise to help you build a reliable, permanent diagnostic framework.
Schedule a consultation with our engineering team:
- Phone: (630) 553-0411
- Email: info@empoweredautomation.com
- Address: 1905 Marketview Dr., Suite 138, Yorkville, IL 60560
Frequently Asked Questions
What is the difference between a direct cause and a root cause in machine downtime?
A direct cause is the immediate event that stopped the machine—for example, a motor overload relay tripping. The root cause is the foundational reason the relay tripped—such as a failing gearbox bearing drawing excessive current, or a cooling fan failing on the drive enclosure. RCA digs past the direct cause to fix the underlying mechanical, electrical, or procedural defect.
Why isn't our SCADA alarm history enough to perform an effective RCA?
Standard SCADA alarm history often logs events at the rate of the communication scan (often 1 second or slower) and records all alarms that occurred during an event simultaneously. If an E-stop circuit drops, 20 sensors might report a fault at the same second. Without PLC-level first-out latching and millisecond sequence-of-events logging, you cannot verify which device triggered the shutdown.
How does a Data Historian assist in root cause investigations?
A data historian stores high-resolution time-series data from process instruments, drives, and controllers. When investigating a failure, engineers can overlay variables—such as motor amperage, system pressure, and line speed—leading up to the exact millisecond of the stop. This reveals subtle drifts and transient spikes that never appeared as formal alarms on the HMI.
Can we automate the 5 Whys process using our control system?
While the "5 Whys" requires human engineering analysis, modern SCADA and MES platforms can automate the data collection for each step. When a fault occurs, the system automatically correlates the stop with the operator shift, the recipe, the raw material batch, the historical maintenance log, and the machine telemetry, giving the investigator instant answers to the first three or four "Whys."
You might also like