OEE for Multi-Site Manufacturers: Standardizing Metrics Across Plants
Key Highlights
- Standardizing overall equipment effectiveness gives every plant one shared language for production efficiency.
- A common OEE score lets you compare lines, shifts, and sites without debating formulas.
- In multi-site manufacturing, consistent data collection improves real time visibility and stronger decisions.
- Unified definitions for availability, performance, and quality support faster continuous improvement.
- One scorecard helps leaders benchmark plants, spot losses, and scale best practices.
- Strong governance keeps reporting credible and supports long-term operational excellence.
Introduction
If you lead operations across more than one production facility, you know the problem. Every site may report overall equipment effectiveness a little differently. One plant includes changeovers. Another does not. One tracks defects at the line. Another tracks them at the shift. In discrete manufacturing, that makes site-to-site comparison weak and improvement harder to scale. The fix is simple in principle: measure OEE the same way everywhere, so leaders can act on facts instead of debating definitions.
Understanding OEE in Multi-Site Manufacturing
At one site, overall equipment effectiveness helps you see how one manufacturing operation or production line is performing during planned production time. You can often resolve gaps quickly because teams share the same process, systems, and local context.
Across several plants, equipment effectiveness becomes harder to track. Multi-site OEE tracking requires aligned OEE data, shared formulas, and standard rules so every location measures losses the same way. Without that consistency, comparing sites is unreliable. That is why standardization matters before benchmarking, dashboards, or network-wide improvement efforts begin.
Defining OEE: Availability, Performance, and Quality Explained
OEE is built from three factors. Availability measures run time against planned production time. Performance measures how fast the asset ran compared with its ideal cycle time. Quality measures how many good parts were produced versus total count. The formula stays the same everywhere: OEE = Availability x Performance x Quality.
That simple structure is what makes standardization possible across multiple plants. If every site uses the same OEE calculations, leaders can trust the number. A shared formula also keeps teams focused on the real source of loss instead of arguing over local math.
Each factor points to a different problem. Availability shows downtime and unplanned stops. Performance losses reveal slow cycles, minor stops, and reduced speed. Quality losses show scrap, startup rejects, and first-pass product quality issues. When every plant uses these same definitions, comparisons become useful.
Tracking OEE in multi-site manufacturing is not just a larger version of single-plant reporting. It introduces new complexity. Different plants may run different equipment, record events in different ways, or use a different manufacturing execution system. Even small differences can distort the OEE score.
Here is where many teams struggle most:
- Inconsistent data collection methods across plants and lines
- Different interpretations of changeovers, breaks, and planned production time
- Site-specific reason codes that block useful comparisons
- Uneven discipline in logging downtime, quality, and operator inputs
Another challenge is organizational. Improvement efforts often stay local because each site trusts its own numbers more than network metrics. That limits shared learning. If one plant improves production efficiency by reducing small stops, you need confidence that the same loss category means the same thing everywhere before you scale that practice.
Why Standardize OEE Metrics Across All Plants?
Standardized OEE metrics give a multi-site operation one reliable view of performance. That matters because production efficiency should mean the same thing in every plant. When formulas, timing rules, and loss categories are aligned, leaders can compare sites with confidence and spot where operational efficiency is strongest or weakest.
Just as important, standardization helps you spread best practices. A plant that cuts changeover time or reduces quality losses becomes a model others can follow. Without common measures, those wins stay local. The next two sections show how unified definitions support better comparisons and better action.
Benefits of Unified OEE Definitions and Formulas
Unified metrics create trust. When every site uses the same OEE calculations for availability, performance, and quality, your teams stop debating the number and start working on the losses behind it. That is essential for continuous improvement at scale.

The practical benefits are clear:
- Shared formulas make production performance comparable across plants
- Common definitions improve data accuracy and reporting discipline
- Standard reason codes create valuable insights into recurring losses
- Leadership can prioritize the biggest network-wide constraints faster
There is also a cultural benefit. Operators, supervisors, plant managers, and operations directors begin using one language for equipment effectiveness. That supports better shift handovers, stronger reviews, and more disciplined root cause analysis. If you want one network scorecard, one set of targets, and one improvement rhythm, unified definitions are the starting point. For a broader overview of OEE basics, see the pillar page at https://www.empoweredautomation.com/oee.
Supporting Site-to-Site Benchmarking and Comparisons
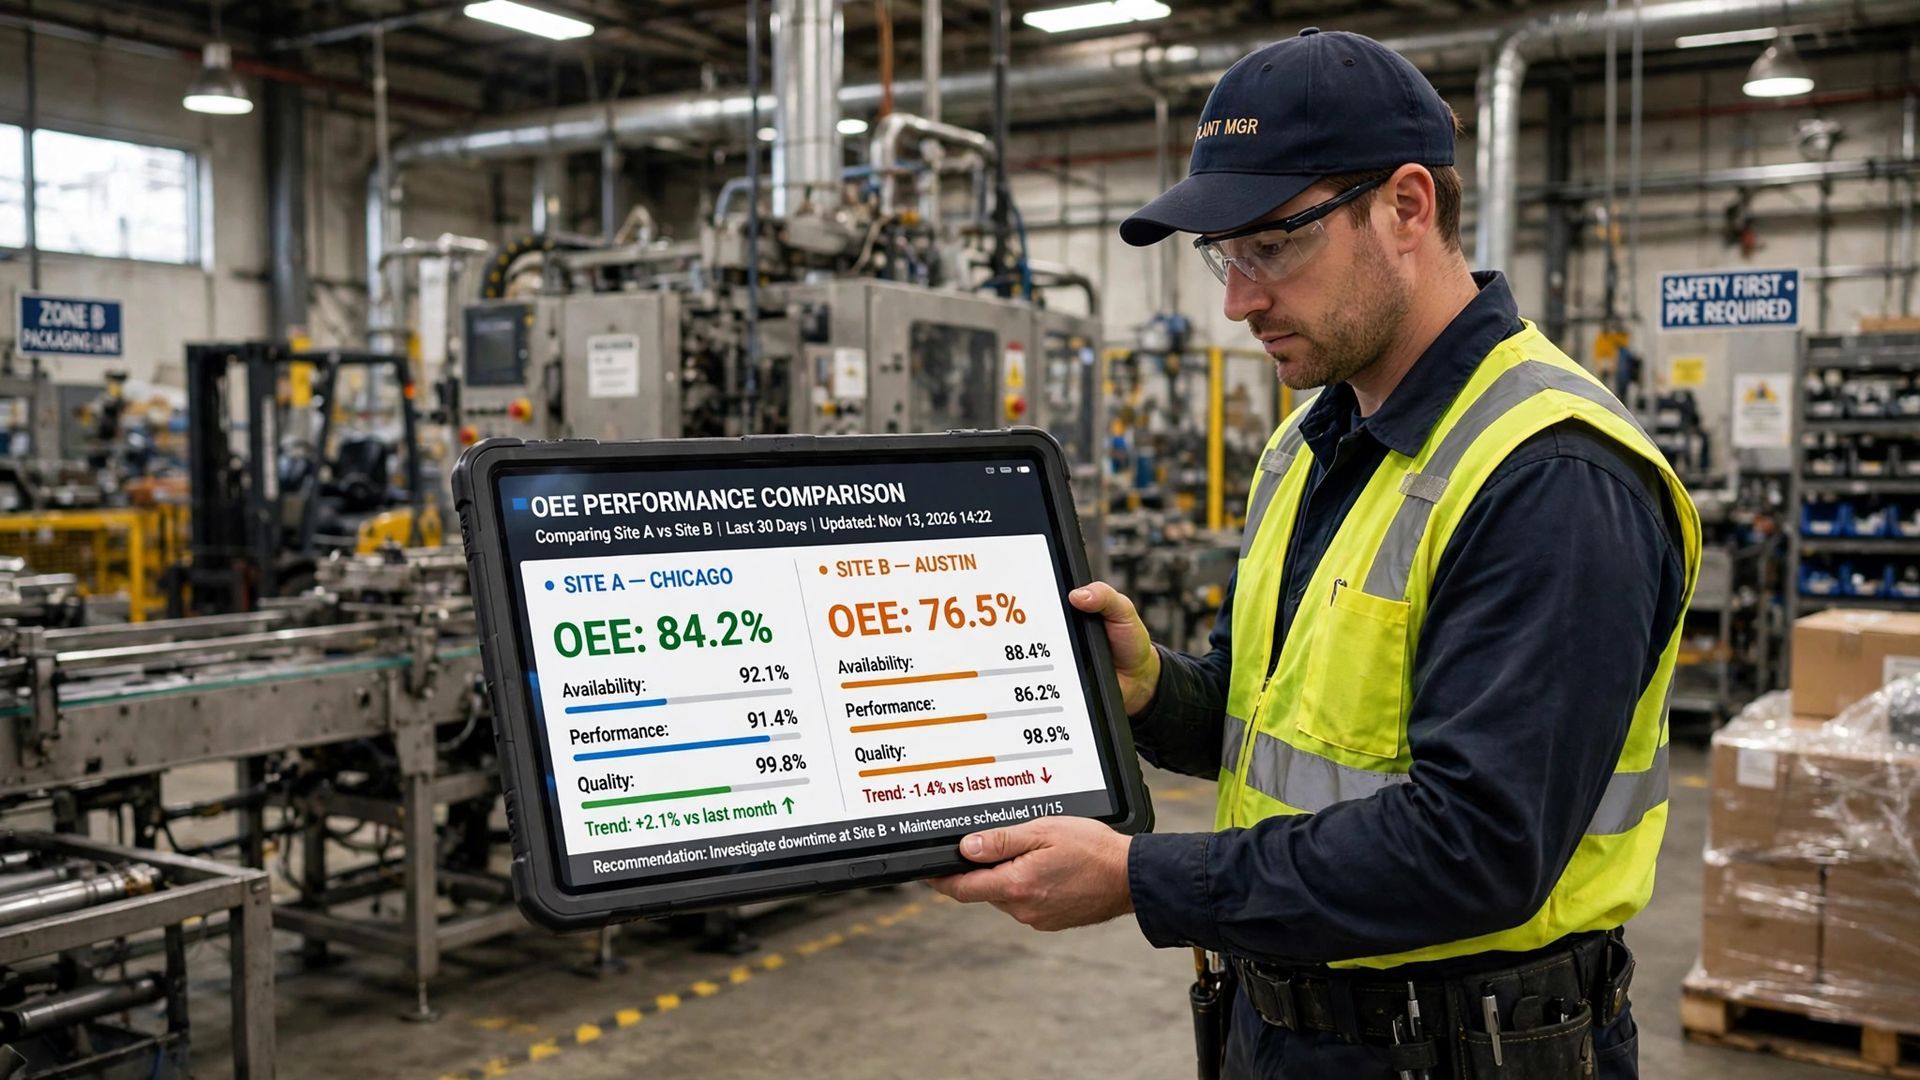
Benchmarking only works when the inputs are consistent. If one plant excludes setup time and another includes it, the OEE score is not comparable. The same is true when defect rules, ideal cycle time assumptions, or stop thresholds vary. Strong benchmarking starts with data accuracy, not a leaderboard.
Traditional metrics can hide these issues because they often stay high level. OEE is more useful because it connects operational data to the actual losses on each production line. Once definitions are aligned, you can compare plants by factor, not just by one combined score.
Comparison Area
Standard Needed for Fair Benchmarking
Availability
Same definition of planned production time and run time
Performance
Same ideal cycle time logic and treatment of slow cycles
Quality
Same good count rules and handling of rework or rejects
Loss analysis
Same reason codes for downtime, small stops, and scrap
With this structure, you can compare like with like and identify which sites have methods worth copying.
Building a Consistent Foundation: Aligning OEE Terminology and Calculations
Before you launch dashboards or benchmarks, align the language. OEE terminology must mean the same thing at every site. Terms like run time, planned production time, good count, and ideal cycle time cannot vary by plant if you want trustworthy OEE data.
This is also where reason codes matter. Sites need the same categories for downtime, speed losses, and quality events. Clear definitions reduce confusion, strengthen OEE calculations, and make equipment performance reviews more useful. The next sections cover how to standardize collection methods and avoid common setup mistakes.
Standardizing Data Collection Methods for Availability, Performance, and Quality
You cannot standardize OEE if every plant captures data differently. Availability, performance, and quality must come from the same rules and the same event logic across the network. That starts with defining what the system records automatically and what requires operator input.
Your standard should cover:
- How planned production time is set for each line or machine
- How run events and stop events are captured for availability
- How cycle time and ideal cycle time are maintained and approved
- How total count, good count, and rework are recorded for quality
Consistency beats complexity. If you rely on handwritten logs at one plant and machine signals at another, comparisons weaken fast. A better approach is to use one method for core data collection, then apply local context only after the base metric is locked. That keeps OEE clean while still giving plants room to solve their own problems.
Common Pitfalls When Establishing Multi-Site OEE Standards
Many multi-site rollouts fail for simple reasons. Teams move too fast to dashboards before they settle definitions. Or they let each plant keep local exceptions that slowly break comparability. The result is inaccurate data and weak trust in the scorecard.
Watch for these common pitfalls:
- Excluding changeovers from production time at some sites but not others
- Using different reason codes for similar losses across plants
- Measuring too short a period and calling it a baseline
- Focusing on the score instead of the losses driving it
Another mistake is comparing unrelated processes. OEE is strongest when you benchmark similar lines, assets, or departments. If plants make very different products, you still need standard rules, but you should compare the right peer groups. That balance protects data accuracy while keeping improvement efforts practical and fair.
Deploying One OEE Scorecard for Multi-Site Operations
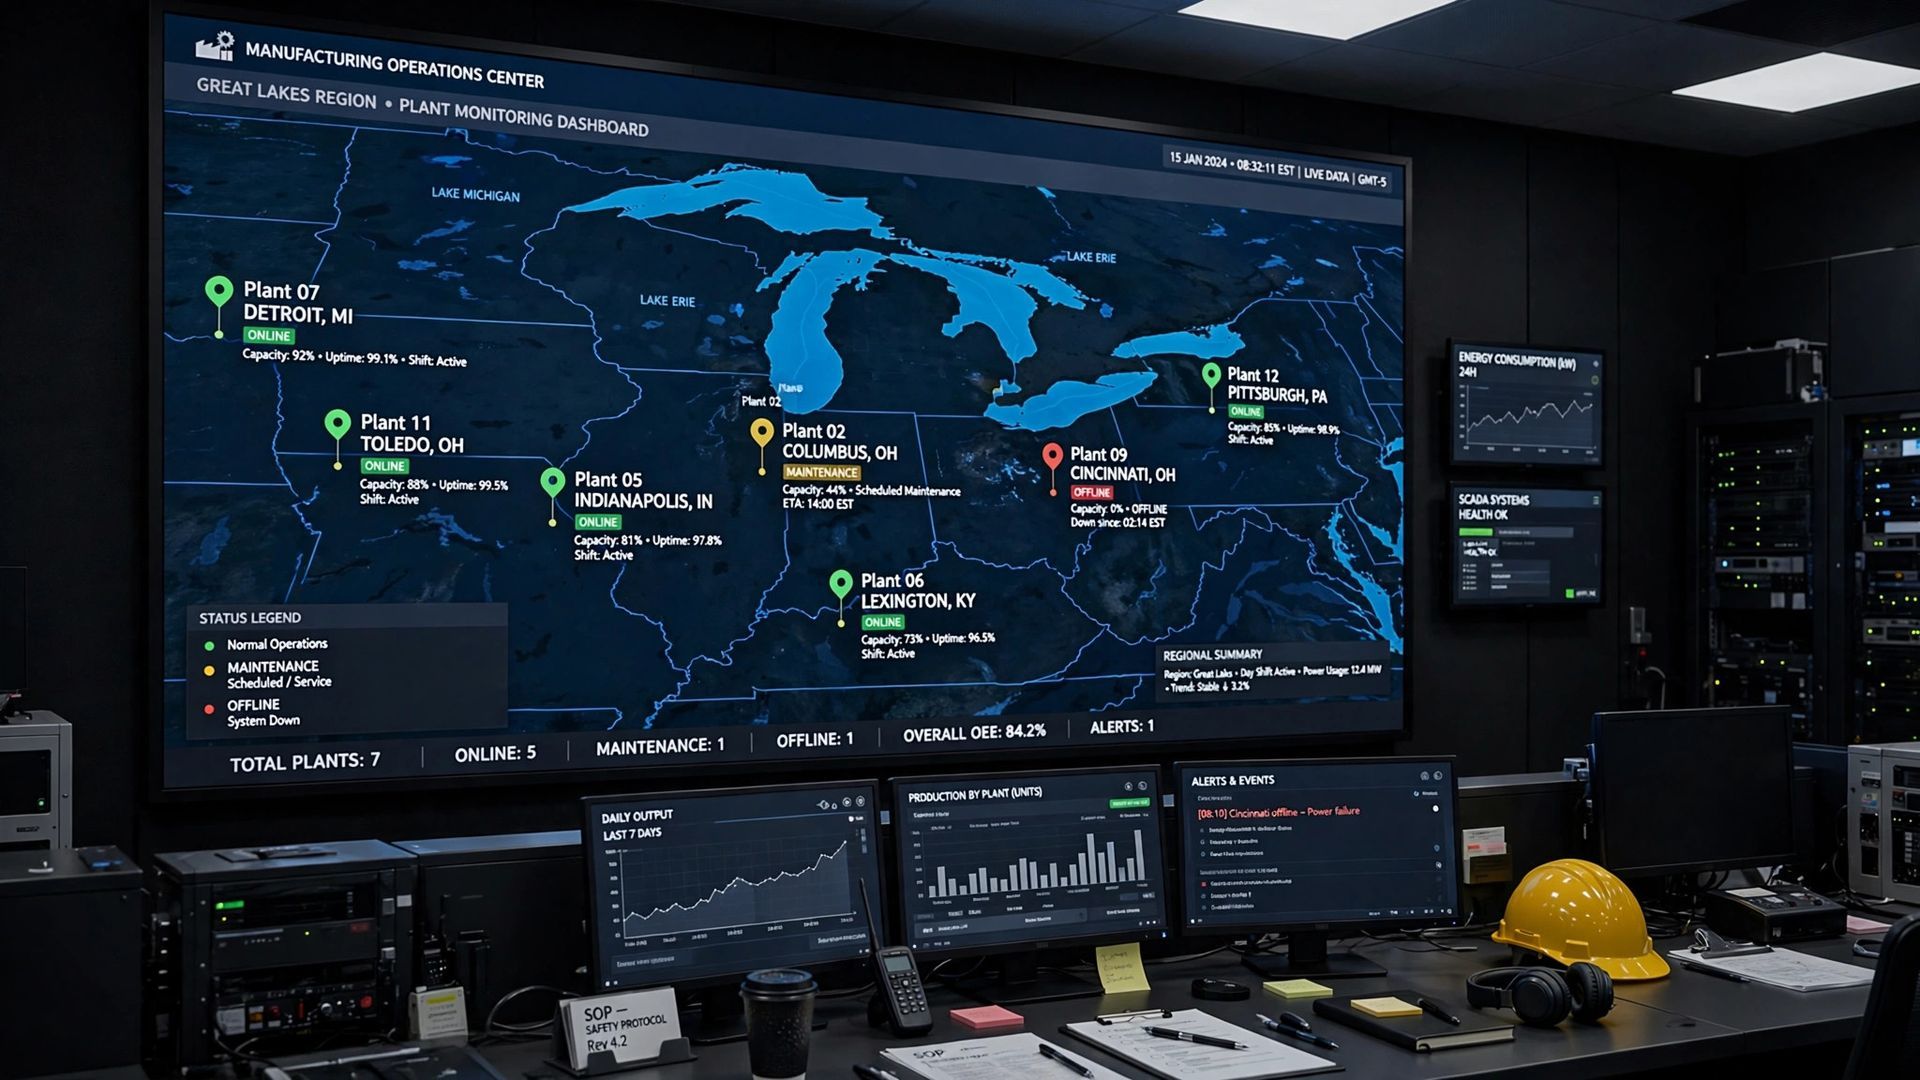
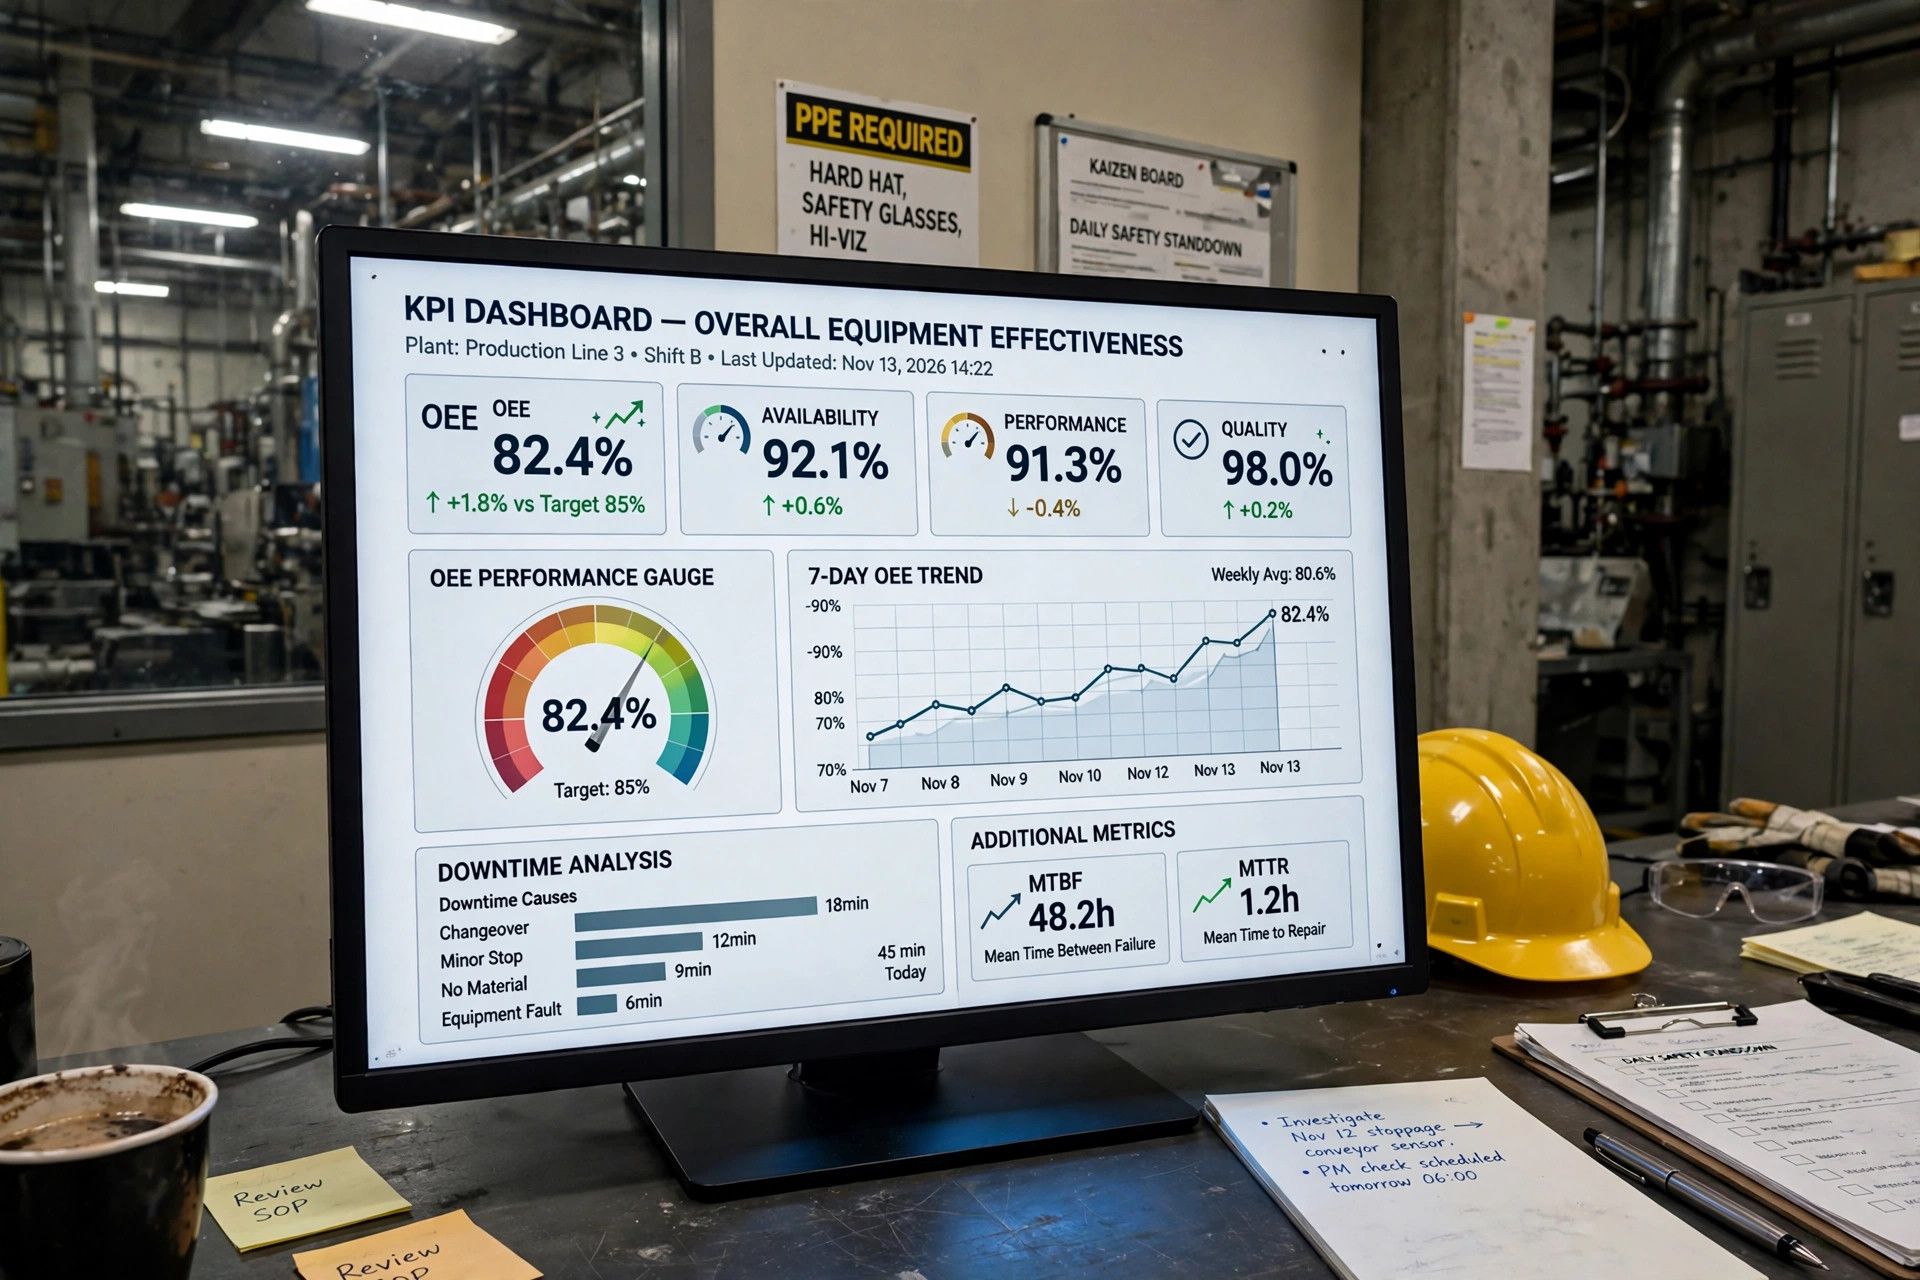
Once definitions are aligned, you can deploy one OEE scorecard across the network. That scorecard should show the same core metrics for every production facility, with drill-down views by site, line, shift, and machine. The goal is one source of truth for a multi-site operation.
A centralized dashboard makes that possible, especially when it updates in real time. It gives executives, plant leaders, and continuous improvement teams one place to review losses and trends. Next, let’s look at how to build that dashboard and expand visibility across every factory.
Steps to Develop a Centralized OEE Dashboard
A strong OEE dashboard starts with one data model. Your sites may have different machines, but the output should land in the same structure for production data, downtime, counts, and quality events. That is what allows a centralized dashboard to scale.
A practical rollout usually follows these steps:
- Define one enterprise formula set for availability, performance, and quality
- Standardize data collection from machines, PLCs, sensors, and operator inputs
- Map site-specific events into shared enterprise reason codes
- Publish one real time scorecard with plant, line, and machine views
The best OEE software for a multi-site environment is the one that captures data continuously, supports live dashboards, and combines machine-sourced data with operator context. Plug-and-play machine data platforms, production monitoring tools, and systems that connect to existing equipment can help. The key is not the brand name. It is the ability to standardize the data and present it consistently.
Ensuring Real-Time Visibility Across Every Factory
Visibility matters because OEE loses power when it is reviewed too late. Monthly reporting may summarize performance, but it does not help the team respond to unplanned stops, minor stoppages, or startup scrap while they are still happening. Real time visibility turns OEE into an action tool.
To extend visibility across every production facility, focus on:
- Continuous capture of production data from the manufacturing floor
- Clear displays for operators and supervisors on the shop floor
- Fast escalation when downtime or slow cycles appear
- Shared dashboards for plant and network leadership
This also improves data accuracy. If operators can see machine conditions and event status as they happen, they can correct errors, confirm reasons, and act sooner. That is why visibility is central to multi-site OEE management. It connects the plant level response to the enterprise view, so losses are not hidden until the month is over.
Data Governance for Reliable OEE Reporting
Even the best dashboard fails without strong data governance. Multi-site OEE reporting depends on rules for ownership, approvals, and change control. If plants can freely edit formulas, thresholds, or event categories, operational data quickly loses consistency.
Good governance protects data integrity from the source through reporting. It defines how data collection works, who validates exceptions, and how updates are rolled out across sites. This is one of the biggest challenges in multi-plant tracking, but it is also what makes the scorecard credible over time.
Creating Data Integrity and Validation Protocols
Reliable OEE depends on disciplined validation. You need to know that run signals, counts, quality entries, and downtime reasons are complete and consistent before they feed the score. That is what data integrity looks like in practice.
Useful validation protocols include:
- Verifying machine states against operator-entered downtime reasons
- Auditing ideal cycle time and count settings on a defined schedule
- Reviewing exceptions where OEE calculations fall outside expected ranges
- Checking that operational data and production data follow the same timestamp logic
These controls do more than catch errors. They reinforce standard behavior across plants. A site cannot quietly redefine a stop category or adjust quality rules without review. For plant managers and operations directors, that means fewer reporting surprises and more confidence that network metrics reflect reality, not local workarounds.
Overcoming Challenges in Multi-Plant Data Management
Multi-plant data management gets messy fast when systems, equipment age, and local habits vary. One site may have modern connectivity. Another may rely on manual entry for parts of the process. Those differences do not remove the need for standard OEE calculations. They just make discipline more important.
Common challenges include:
- Different machine interfaces and uneven signal quality
- Manual data collection in some areas of the network
- Inconsistent update control for formulas and reason codes
- Too much focus on reporting and not enough on continuous improvement
The answer is to simplify and govern. Standardize the core metric structure, capture what you can automatically, and validate the rest with clear ownership. Then use the data to guide improvement efforts. OEE should not become a corporate scorekeeping exercise. It should help each site understand losses and act on them in the same structured way.
Conclusion
In conclusion, standardizing OEE metrics across multi-site manufacturing plants is crucial for achieving consistent performance and quality measurement. By developing a unified approach to definitions, formulas, and data collection, you can facilitate better site-to-site comparisons and benchmarking. This not only enhances transparency but also promotes data governance and integrity, ensuring that all facilities are evaluated on the same playing field. As you work towards implementing a centralized OEE scorecard, remember to address the unique complexities of multi-site operations. For further insights and guidance, explore our comprehensive OEE pillar page
here to enhance your understanding and refine your strategies effectively.

Frequently Asked Questions
What factors most influence differences in OEE between manufacturing sites?
The biggest drivers are usually differences in run time loss, how each production facility defines planned time, variation in ideal cycle time settings, and inconsistent quality rules. Product mix and changeovers also matter. If those inputs are not standardized, the OEE score will reflect reporting differences as much as true production efficiency.
How can I choose the right OEE software for multi-site environments?
Choose OEE software that supports consistent data collection across sites, captures machine and operator inputs in real time, and feeds one centralized dashboard. It should standardize operational data structures, not just visualize them. The best fit is the platform that helps every plant measure OEE with the same rules.
What are common mistakes to avoid when standardizing OEE across plants?
Common mistakes include letting sites keep different OEE calculations, using inconsistent reason codes, excluding changeovers, and comparing unrelated processes. Those choices hurt data accuracy and weaken improvement efforts. Another mistake is chasing one performance score while ignoring the real drivers, especially quality losses and speed-related issues.
oee multi-site manufacturing
You might also like