OEE Improvement Roadmap: From Baseline to World Class in 12 Months
Key Highlights
- This oee improvement roadmap shows how to move from a trusted baseline toward the gold standard in 12 months.
- You will see how overall equipment effectiveness depends on accurate production data before any plant changes begin.
- The plan follows OEE = Availability x Performance x Quality across clear monthly phases.
- Each phase targets equipment efficiency with practical actions, owners, milestones, and review points.
- Continuous improvement stays focused on losses, not blame.
- Quarterly reviews keep results visible and priorities aligned.
Introduction
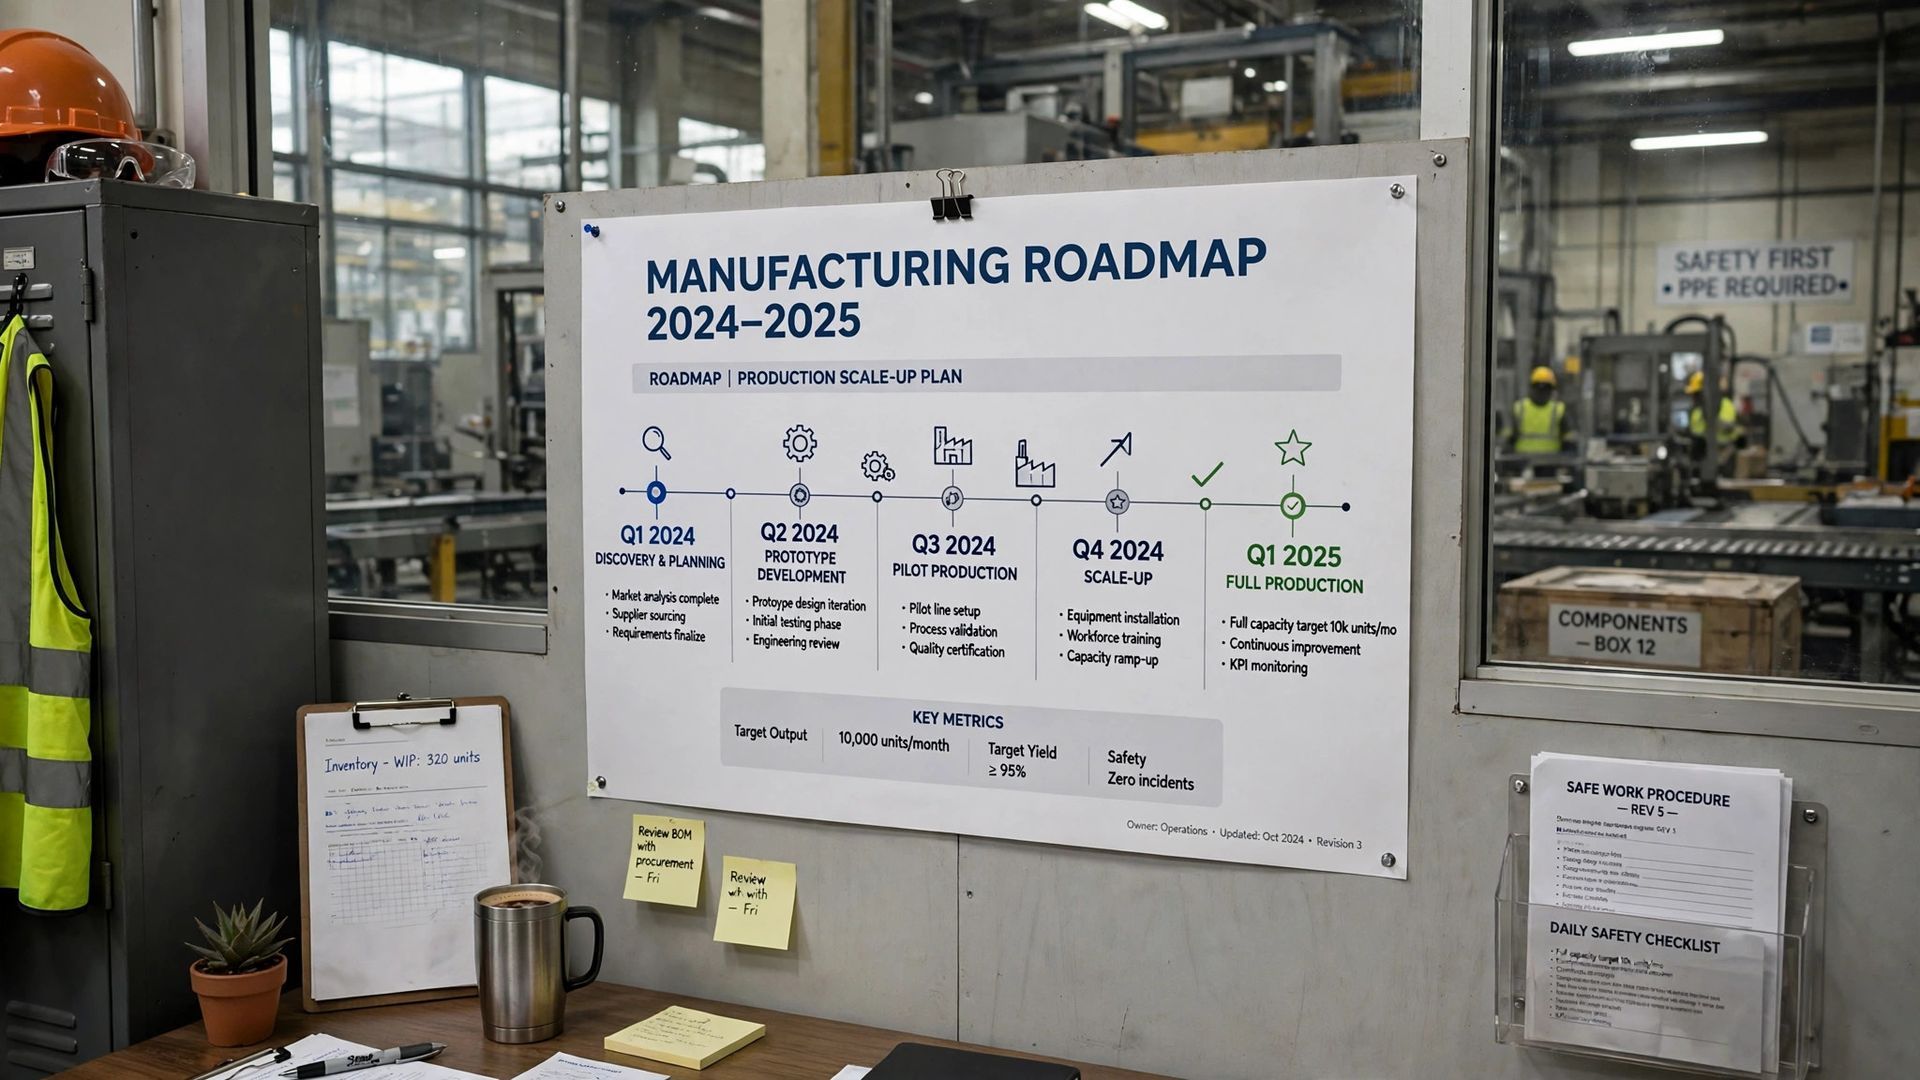
If you lead a production line or an entire manufacturing facility, you need an OEE plan that is simple, measurable, and realistic. This oee improvement roadmap gives you a 12-month path from an accurate starting point to world-class performance. It starts with trusted data, then moves through availability, performance, and quality in the right order. That matters because you cannot improve what you cannot measure, and you should not attack every loss at once.
Understanding OEE and Its Importance in Manufacturing
Overall equipment effectiveness is a practical way to measure how well a manufacturing process turns scheduled time into good output. Unlike a single machine efficiency number, it shows whether your equipment effectiveness issue is really about lost time, slow running, or poor quality.
That is why OEE matters for overall equipment productivity. A low oee score points to operational efficiency losses inside the process. A high score with missed demand may point to a capacity problem instead. Next, break OEE into the factors you can manage.
Defining OEE: Availability, Performance, and Quality Explained
Start with the formula: OEE = Availability x Performance x Quality. Each oee factor shows a different kind of loss, which is why the score is useful on a busy plant floor. You are not looking at one blended number without context. You are seeing where production time is being lost.
Availability reflects equipment availability during planned production. If the machine is down for breakdowns or changeovers, that factor drops. Performance captures performance losses such as minor stops, small stops, and slow cycles that reduce output versus target speed.
Quality shows quality losses from startup defects and scrap or rework. Put together, these factors explain what impacts the score most. If equipment is not running, availability is your issue. If it runs below target, performance is the constraint. If output includes defects instead of good parts, quality is pulling OEE down.
The Business Impact of OEE on Plant Productivity
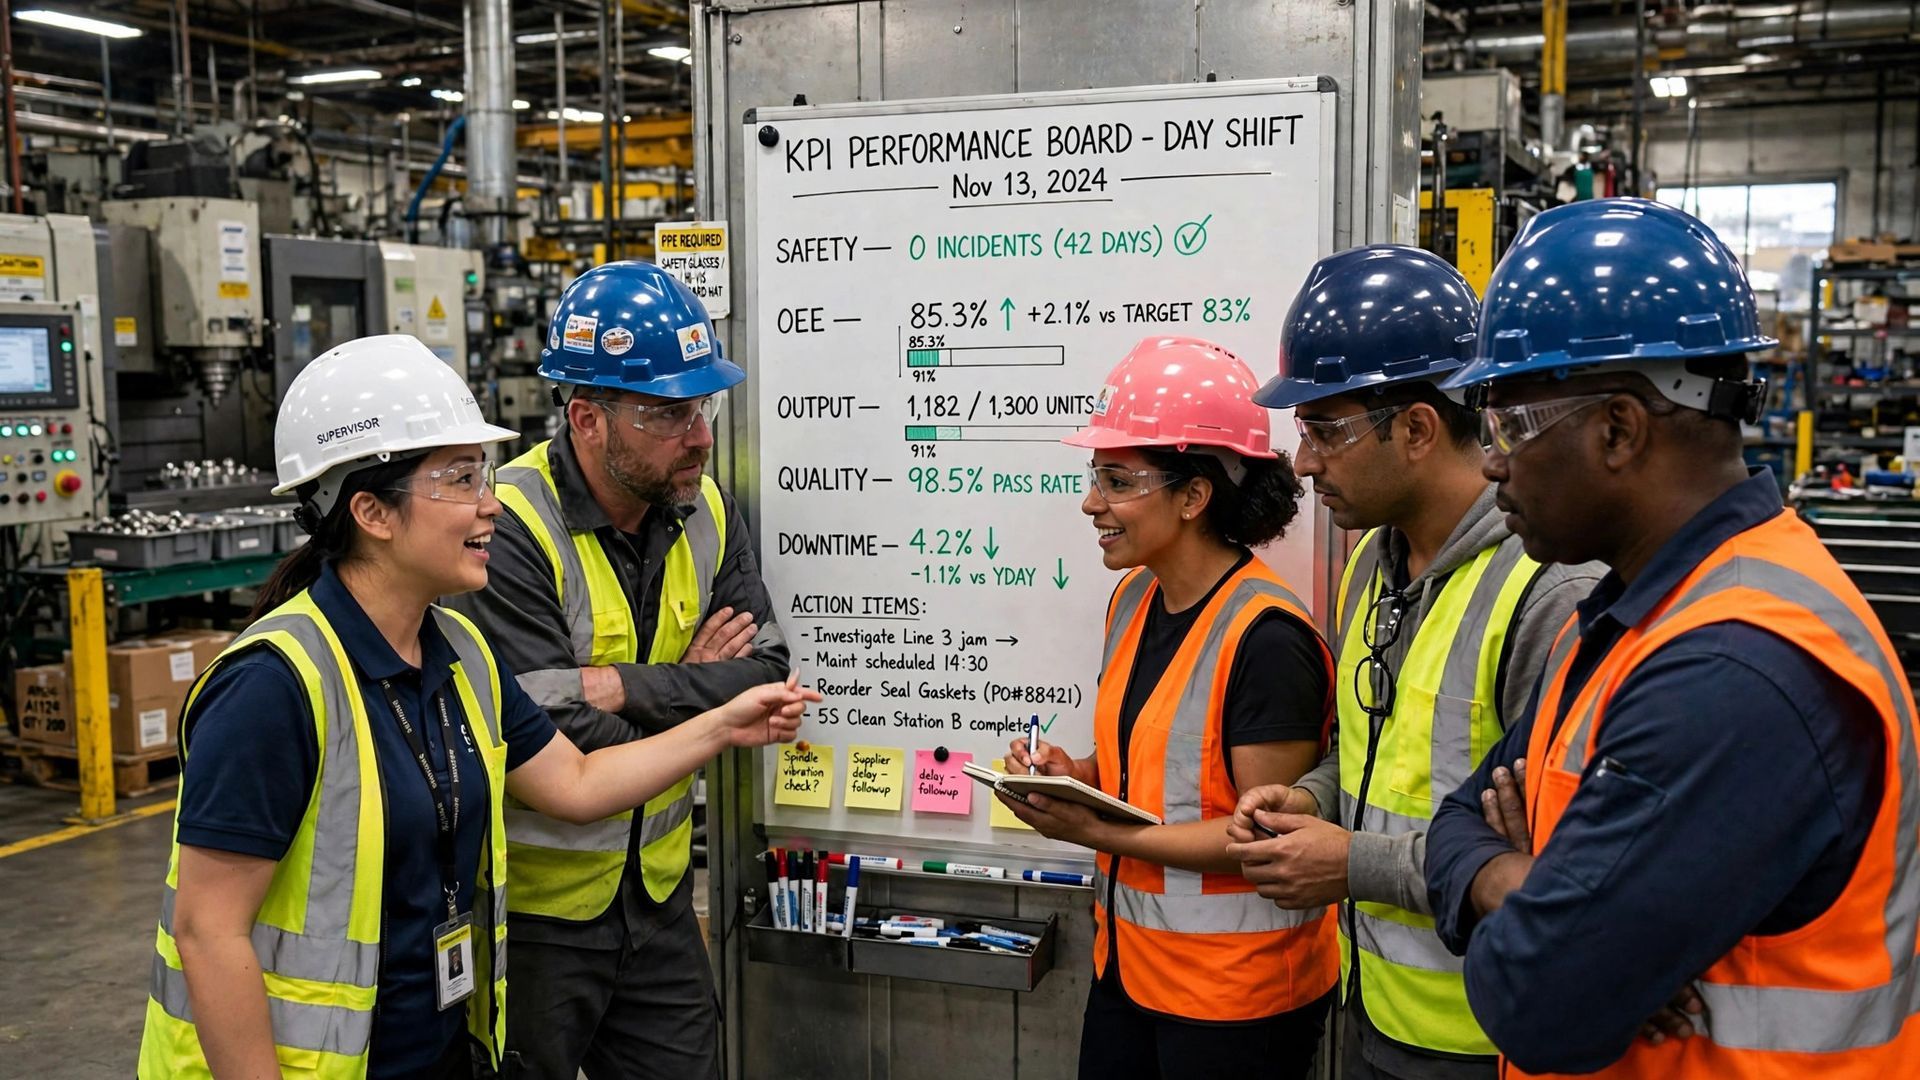
On the shop floor, OEE gives you a clearer view of equipment productivity than isolated uptime numbers. It connects downtime, speed, and defects to one measure, so your team can see where the production process is actually losing output. That makes decisions faster and more practical.
For plant managers, OEE also works as one of the most useful key performance indicators because it separates an equipment effectiveness problem from a true capacity shortfall. If your line runs with a low score, there is waste inside the system. If OEE is high and demand is still missed, you likely need more capacity.
Want quick gains? Start by capturing accurate data, identifying the biggest losses, and prioritizing them in order of impact. That approach avoids scattered improvement work and helps you focus on what will move output first.
Why Setting the OEE Benchmark at 85% Matters
An 85% oee score is widely treated as a gold standard because it gives your plant a clear target without pretending every process is identical. It is not just a number to post on a board. It is an oee benchmark that helps your team define what better looks like.
Still, the value of 85% is in the path, not the slogan. A plant at 55% needs a disciplined sequence: accurate measurement, loss analysis, targeted actions, and regular follow-up. That is why sustainable gains over 90 days come from focused work on the top losses rather than broad campaigns.
Use 85% as a destination for continuous improvement. Then set quarter-by-quarter targets that fit your current state, bottleneck, and data quality. A credible target builds confidence. An arbitrary one creates noise. The next step is establishing a baseline you can trust.
Establishing Your OEE Baseline for Continuous Improvement
Before you launch projects, build an oee baseline from reliable production data. Measuring OEE is what turns equipment efficiency improvement from opinion into fact. It shows whether losses come from downtime, slow running, or defects, and it helps you see spare capacity versus true equipment limits.
Just as important, the baseline sets up continuous improvement. Without it, your team cannot tell if actions worked or if results only shifted from one loss bucket to another. Start with data quality, then calculate the current score and isolate the losses driving it.
Gathering Accurate Production Data
The first step in any OEE effort is gathering accurate production data. If your oee data is incomplete, delayed, or inconsistent, every action that follows will be weaker. Many plants still rely on manual data collection, but short stops and brief slowdowns are easy to miss when operators are busy running the line.
A stronger approach is to combine operator input with real time data collection from the equipment. That gives you a fuller view of downtime, speed, and quality events without asking people to record every small interruption by hand.
- Capture start, stop, and count signals automatically whenever possible.
- Use operator reason codes for exceptions, planned downtime, and visible causes.
- Audit manual logs against system counts to find data gaps early.
For a quick win, focus your baseline on the bottleneck process first. That is where bad data causes the most damage and where better visibility usually creates the earliest gains.
Calculating Your Current OEE Score Step by Step
Once your data is credible, calculate the current oee score in a repeatable way. Start with planned production time, then remove downtime to get run time. Next, compare actual output to expected output based on target rate or ideal cycle assumptions. Finally, compare good output to total output.
The formula matters, but so does consistency. If machine settings or speed targets change from shift to shift without a standard, your score will not be comparable over time. Standard definitions are part of an accurate baseline.
Step
What to calculate
1
Planned production time for the line or bottleneck asset
2
Run time after subtracting downtime from planned production time
3
Performance using output against target rate during run time
4
Quality using good parts versus total parts produced
5
Final OEE by multiplying Availability x Performance x Quality
Use one method every day, every shift, and every product family where practical. Consistency builds trust in the number.
Identifying Key Losses Impacting Equipment Efficiency
After you have the score, find the losses underneath it. The six big losses help you sort losses into categories that are easier to compare and prioritize. This is where OEE becomes actionable. Instead of saying the line is underperforming, you can point to the exact patterns that are reducing equipment efficiency.
Availability losses often come from changeovers and unplanned downtime. Performance losses show up as minor stops, slow cycles, and speed losses versus target. Quality losses usually split into startup defects and scrap. Each category points to different causes, so each needs a different response.
- Rank the big losses by impact using Pareto or waterfall views.
- Separate chronic issues from rare but severe events.
- Check whether cycle time loss is happening at the bottleneck.
This analysis is how you boost OEE performance. It tells you where to start and where not to waste effort.
Month 1–3: Laying the Foundation for OEE Success
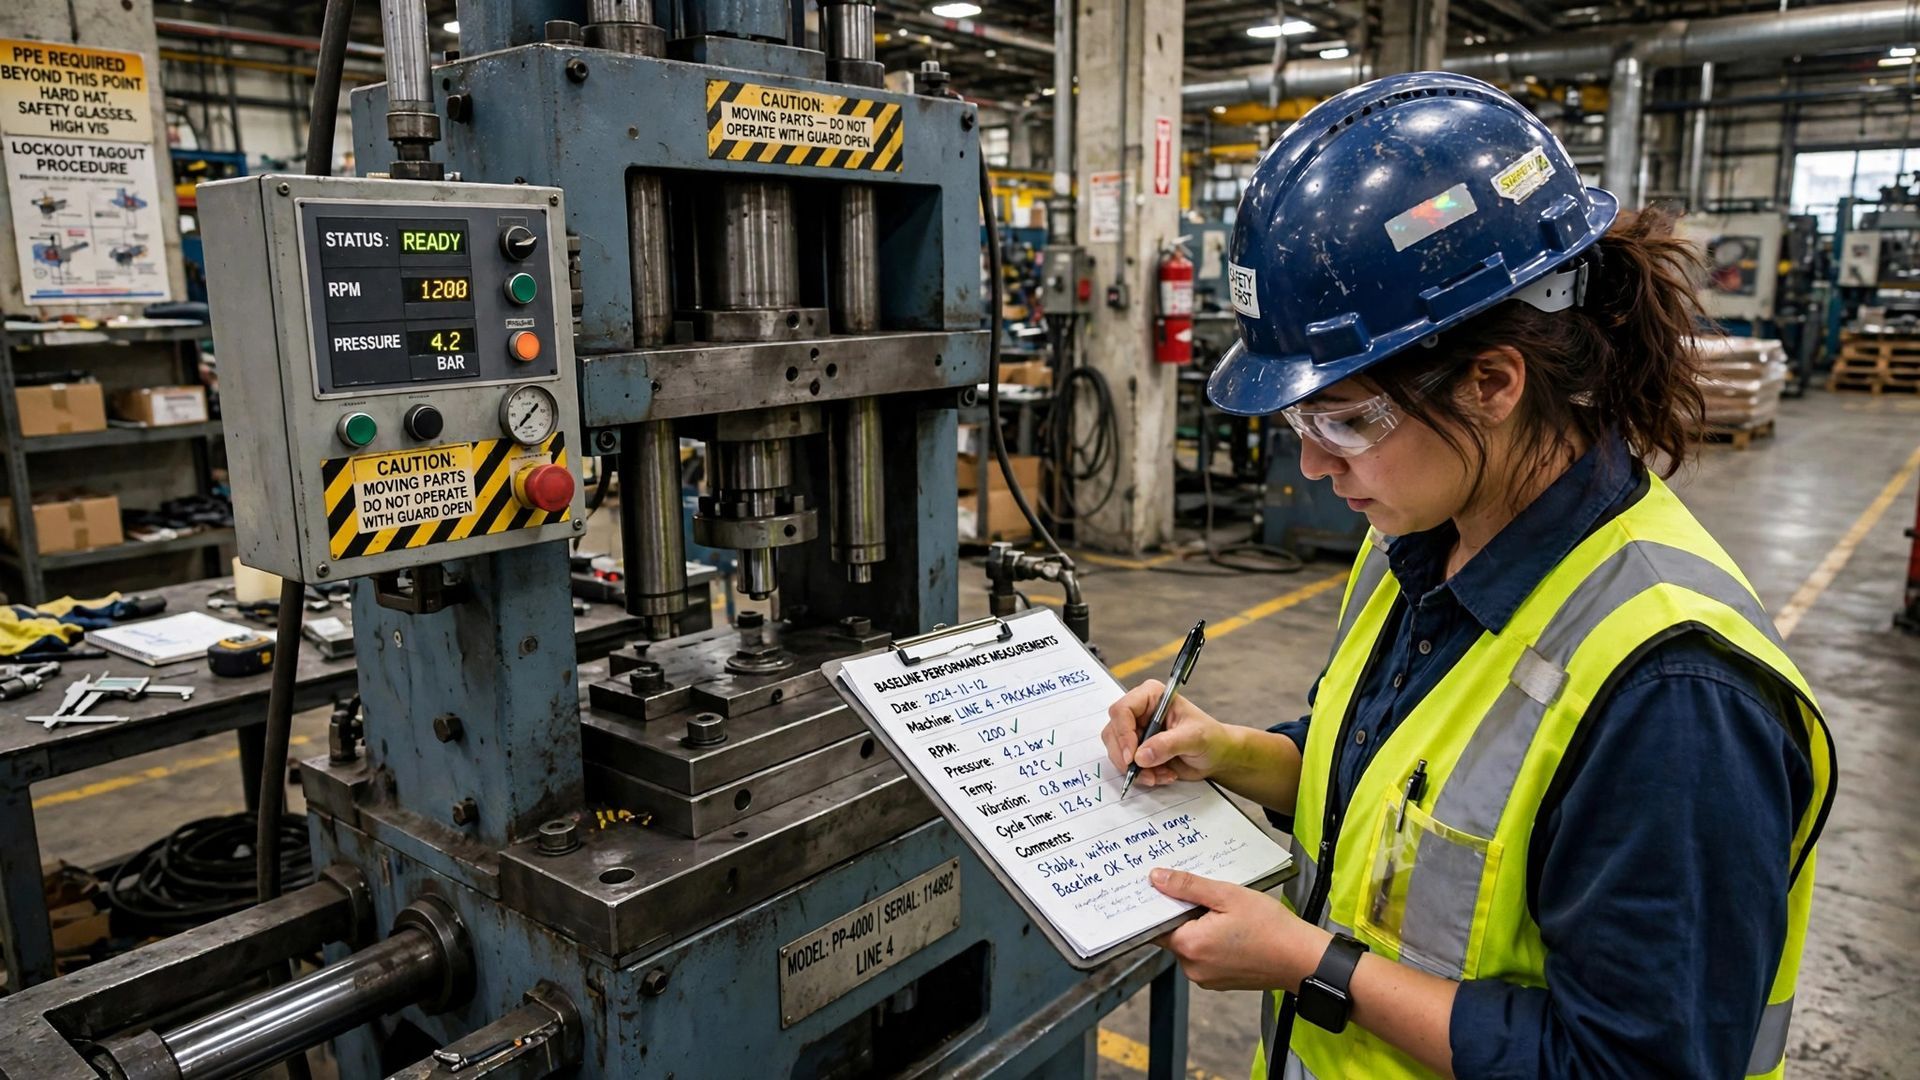
In the first 90 days, your goal is not world-class OEE. It is a stable system for improvement. The first step is building an oee improvement team, agreeing on definitions, and making sure data from the shop floor is trusted. Without that, every target will be debated instead of acted on.
At this stage, train operators, set monthly milestones, and create visibility around the bottleneck. By the end of Month 3, you should have a baseline, a ranked loss list, and clear ownership for the next phase.
Building a Cross-Functional OEE Improvement Team
You cannot improve OEE with production alone. A strong oee improvement team brings together operations, maintenance teams, supervisors, engineering support where available, and operators from the target production line. That creates a comprehensive approach because most losses cross department boundaries.
Plant leaders should name a single owner for the roadmap, but each loss type needs clear support. Maintenance may lead breakdown analysis. Operations may lead changeover and standard work. Operators should help identify chronic issues because they see them every shift.
- Plant manager or operations leader: sets targets and removes barriers.
- Line supervisor and operators: validate losses and daily actions.
- Maintenance teams: address reliability, downtime events, and follow-up work.
To involve people well, focus on the process rather than blame. When teams see the work as system improvement, engagement rises and resistance drops.
Training Operators on OEE Metrics and Tracking
Operator training should be practical, not theoretical. Train operators on what the oee score means, how production time is classified, and why accurate reason codes matter. If people do not understand the categories, you will get poor data and poor decisions.
Just as important, explain what operators are not responsible for. OEE is about process loss, not personal blame. When the system is framed that way, operators are more willing to support tracking, flag chronic issues, and help confirm the true cause of events.
If your plant still uses manual logs, standardize them. Define what counts as a minor stop, when a stop becomes a breakdown, and how startup defects are recorded. These best practices improve manufacturing efficiency because better oee data leads to better priorities, better actions, and fewer wasted meetings.
Using Digital Tools for Real-Time OEE Monitoring
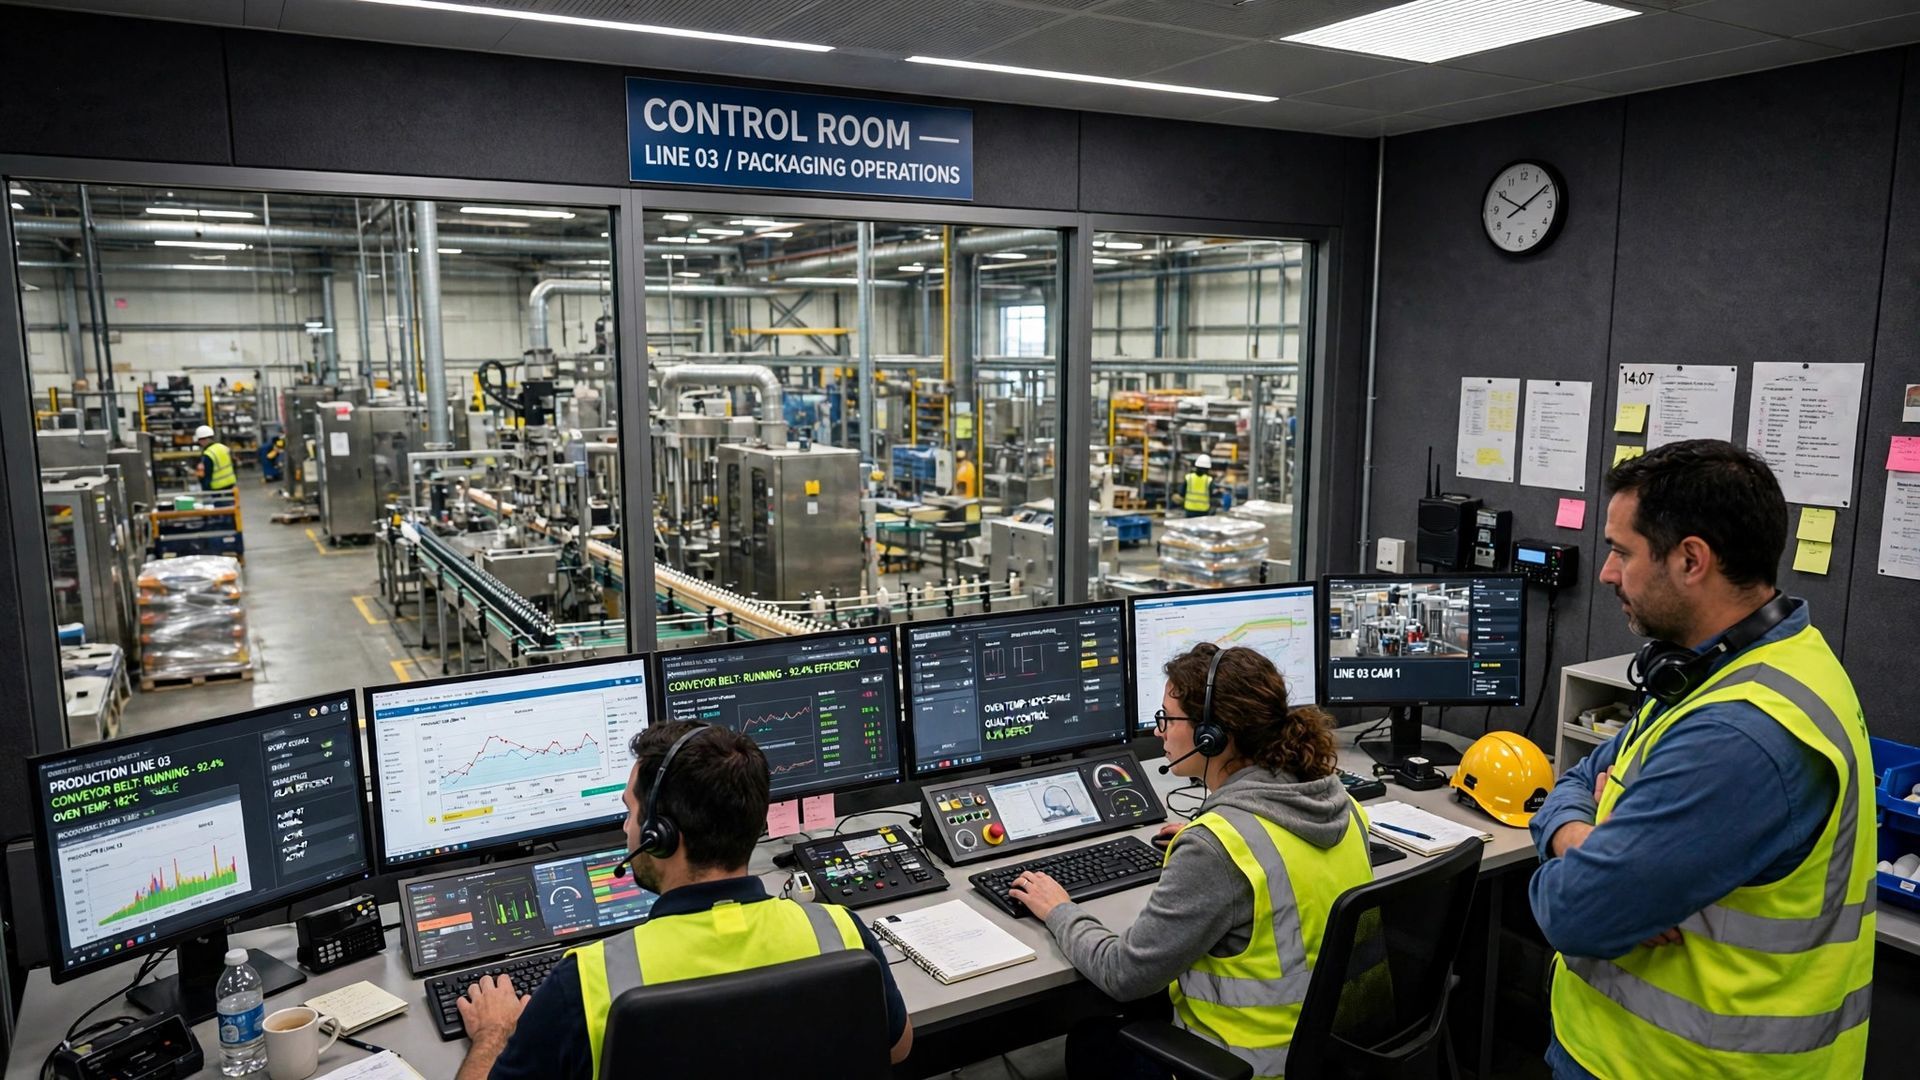
Digital tools help you move from delayed reporting to real time visibility. That is especially important for minor stops, short interruptions, and speed changes that manual systems usually miss. Better data capture gives plant leaders faster feedback and better daily control.
In many facilities, iot sensors or existing machine signals can automate count, state, and downtime collection. Pair that with operator inputs for reason codes and you get a more complete view of the line. Over time, advanced analytics can help spot recurring patterns behind losses and production defects.
- Automate count and run-state collection on the bottleneck first.
- Use dashboards to show top losses by shift, line, and asset.
- Review trends daily so issues are acted on while they are still fresh.
A natural milestone for Month 3 is simple: one trusted source of OEE truth for the pilot line, reviewed every day.
Month 4–6: Tackling Availability Losses Head-On
With the baseline in place, shift your attention to equipment availability. In most plants, the fastest gains come from reducing unplanned downtime, tightening changeovers, and making planned work more predictable. When the line is not running, no other OEE factor can help you.
During Months 4 through 6, set monthly availability targets, attack the top downtime categories, and align preventive maintenance with actual failure patterns. This is also the right time to formalize maintenance schedules and review progress every month.
Strategies to Reduce Equipment Downtime
Start with the biggest equipment downtime categories, not the longest list of complaints. Separate planned and unplanned stops, then sort downtime events by frequency and severity. Chronic issues often need structured problem solving. Sporadic failures may be easier to trace because the event is larger and more visible.
Your best early strategies are simple: improve failure tracking, standardize maintenance procedures, and make sure root causes are documented before the next occurrence. If you can predict a likely failure pattern from condition or trend data, predictive maintenance becomes a strong next step.
- Split losses into breakdowns, starved, and blocked conditions.
- Prioritize the bottleneck asset before supporting equipment.
- Use predictive maintenance where real-time condition data can prevent repeat failures.
A practical Month 6 target is a measurable drop in unplanned stops on the constraint process, supported by weekly review of top downtime events.
Streamlining Changeovers and Preventive Maintenance
Changeover time is one of the clearest availability losses because it is visible, frequent, and often accepted as normal. It should not be. Use SMED thinking to separate internal tasks from external tasks, move work outside the shutdown window, and simplify the tasks that remain while the line is stopped.
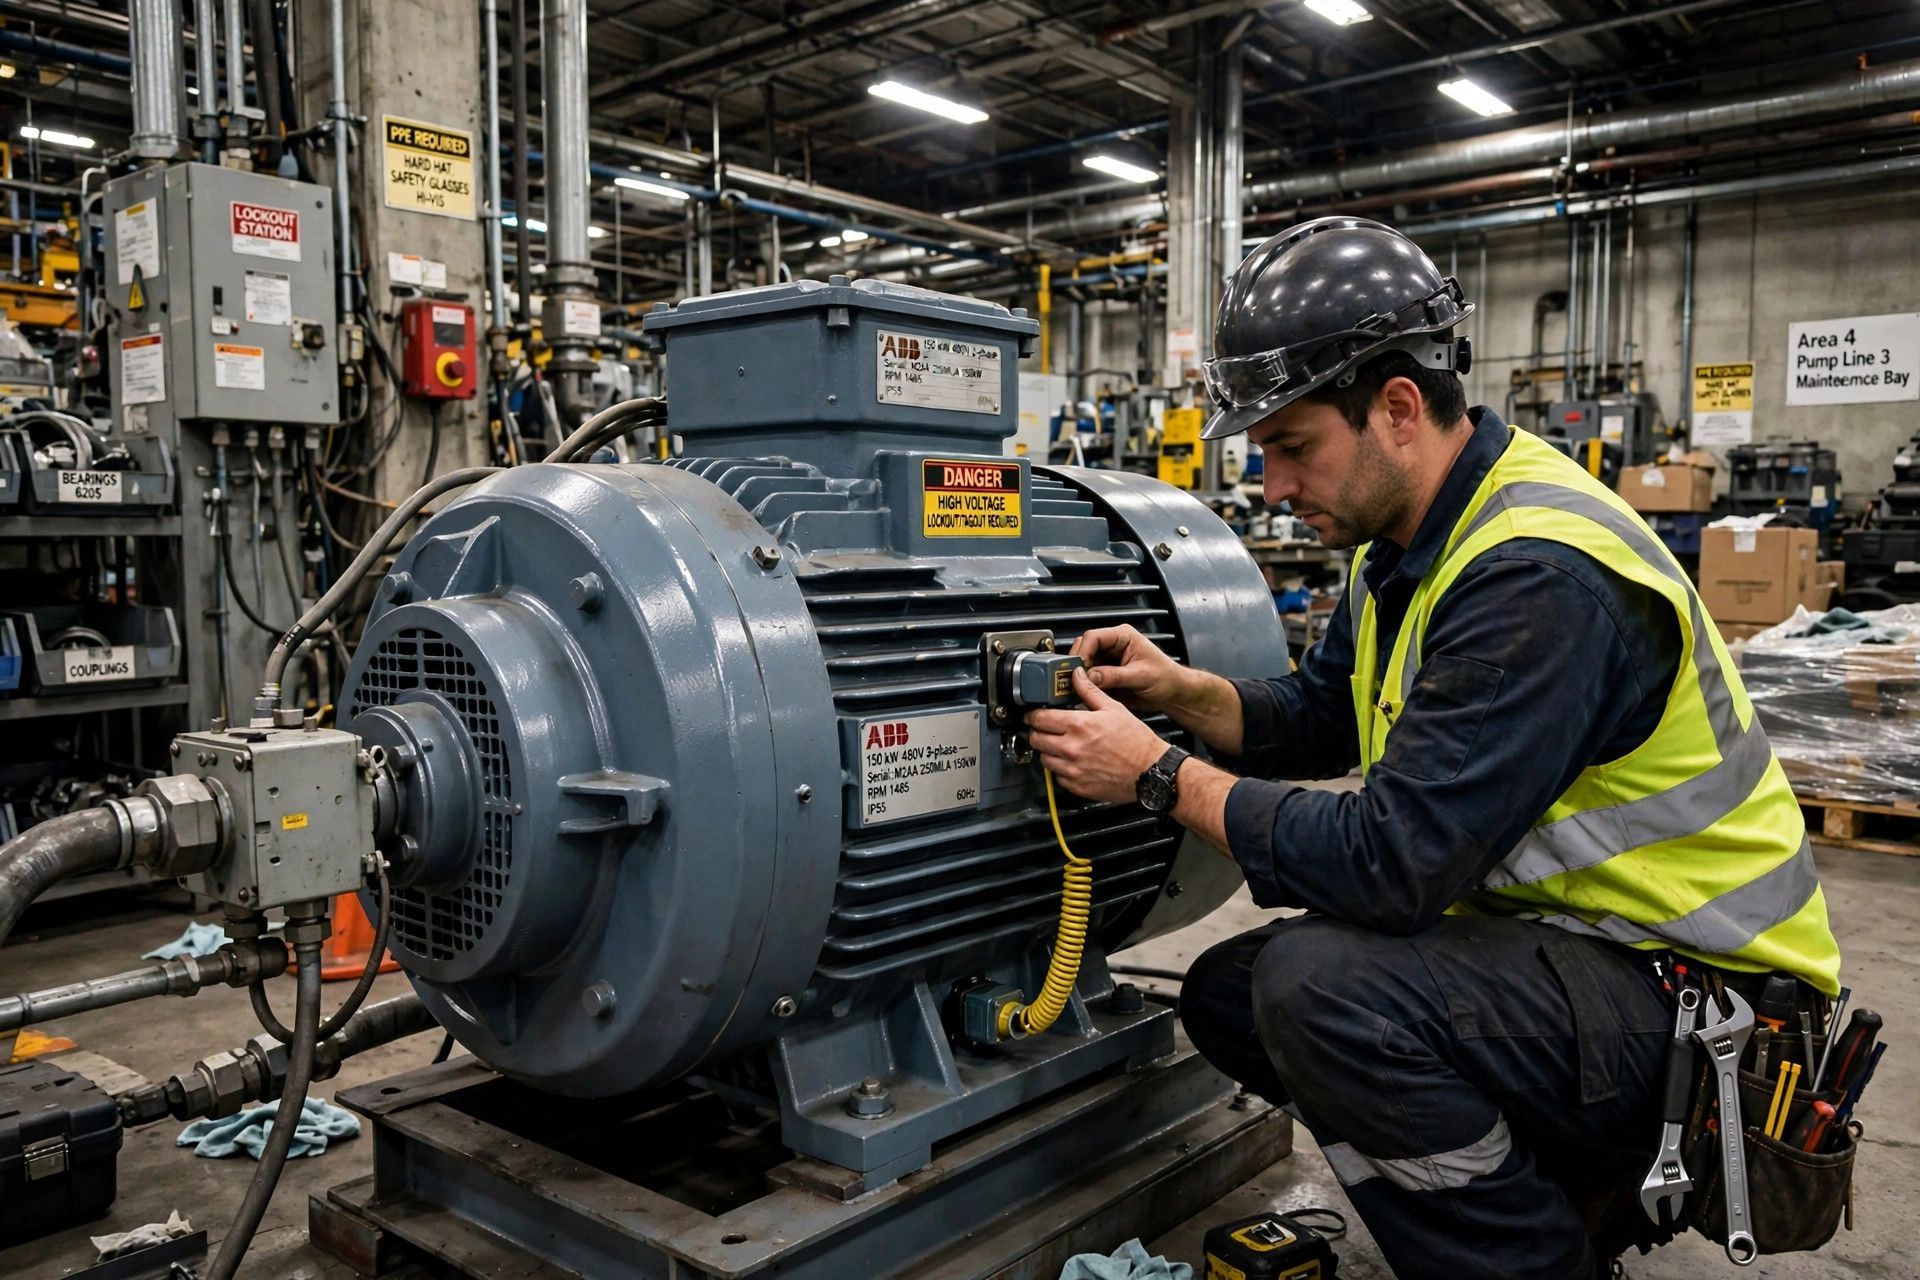
On the same timeline, strengthen your preventive maintenance program. Planned downtime for cleaning, inspection, and service should be structured, repeatable, and scheduled around production needs rather than handled reactively. Good maintenance schedules reduce failure risk and support more stable output.
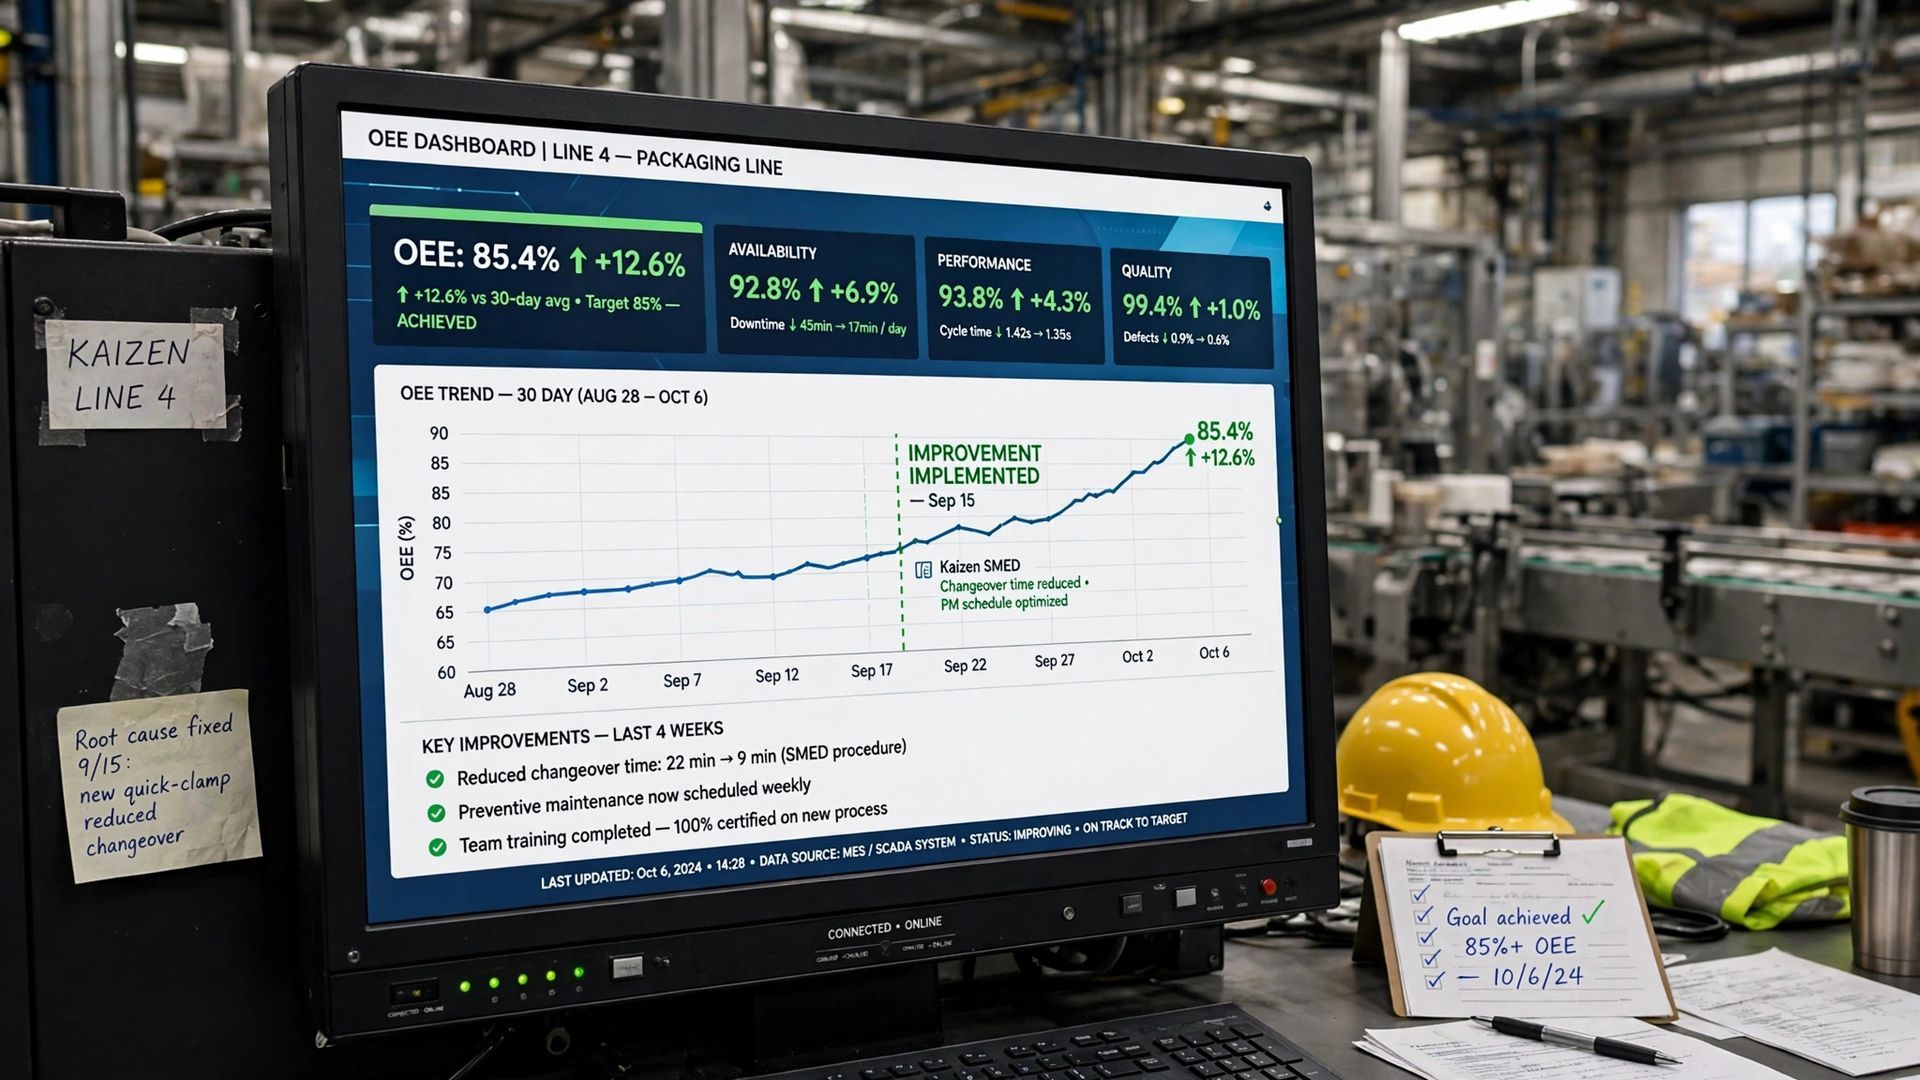
You will often find overlap between these efforts. Better setup methods, simpler fasteners, repeatable settings, and pre-staged tools can cut changeover time and reduce startup variability. By Month 6, you should see shorter changeovers, better schedule adherence, and fewer maintenance-related disruptions on the production line.
Tracking Progress and Adjusting Targets
By this point, your plant should move from activity tracking to result tracking. Review the oee score weekly and availability losses daily for the pilot area. Use a short list of key performance indicators tied directly to loss reduction, not a long board full of unrelated metrics.
Make your targets specific and time-bound. For example, reduce unplanned downtime on the bottleneck by a defined percentage, cut average changeover minutes, or improve run time within scheduled production time. These are the kinds of 90-day strategies that hold up because they are measurable and tied to production data.
Then adjust. If one loss improves but another grows, update the plan. If a target was based on bad assumptions, correct it quickly. Quarter 2 should end with a formal review of gains, gaps, and the next set of priorities for performance improvement.
Month 7–9: Boosting Performance and Speed
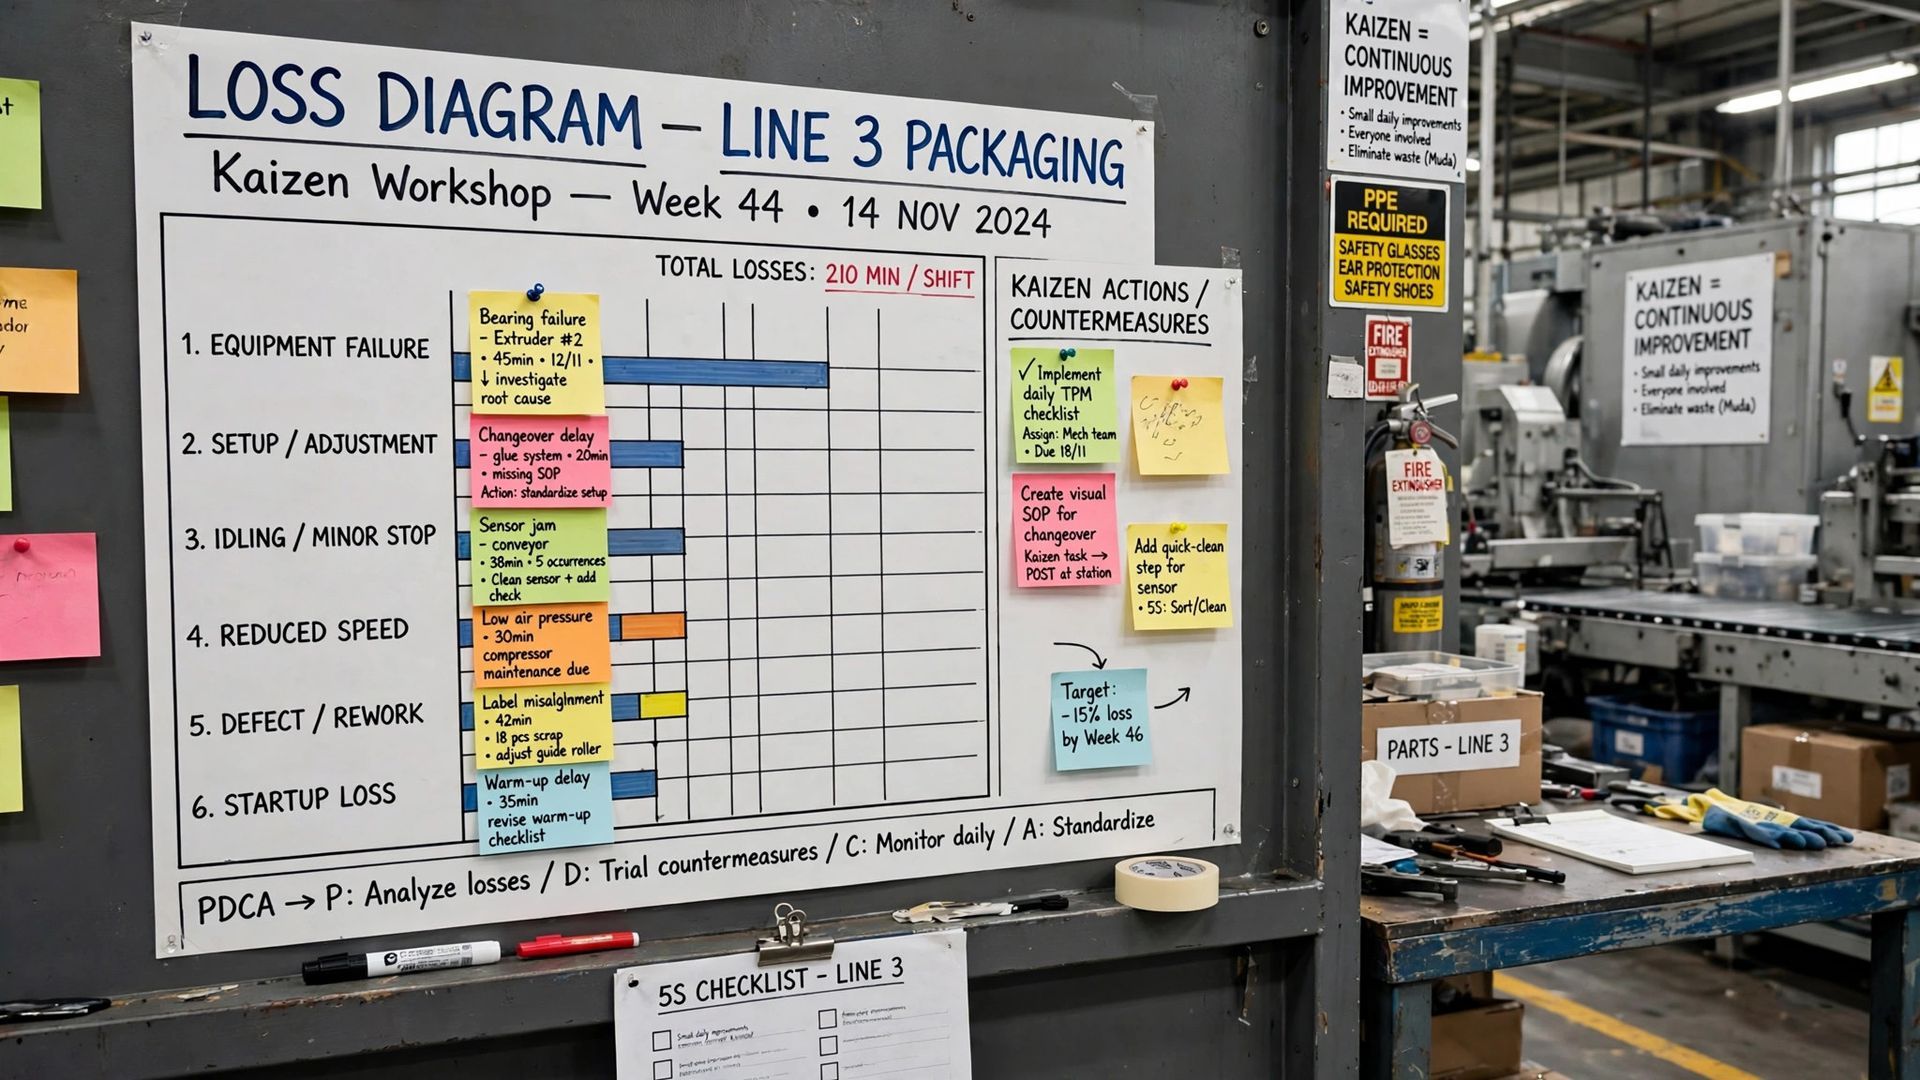
Once availability is more stable, turn to equipment performance. Here, the common losses are minor stops, reduced machine speed, and poor coordination across the line. The line may be running, but it is still not producing at the rate your run time should allow.
During Months 7 through 9, focus on the bottleneck, define a credible ideal cycle time or target speed, and make speed losses visible every shift. That is how performance starts to move in a lasting way.
Addressing Minor Stops and Short Stops
Minor stops deserve more attention than they usually get. These small stops may last less than five minutes, but they break flow, reduce run time, and can add up to a major performance loss over a shift. They often hide in the gaps between major downtime events.
Because operators live with these issues, involve them directly. They can usually point out chronic jams, adjustments, and integration problems between machines. Automated tracking is critical here because manual systems rarely capture enough stop time detail to show the real pattern.
- Trend minor stops by asset, shift, and product.
- Observe the line while it runs to confirm recurring triggers.
- Check for starved and blocked conditions without an obvious upstream or downstream equipment failure.
Analyzing these losses boosts OEE because it converts hidden interruptions into visible improvement work. Month 9 should show a clear reduction in chronic small stops at the bottleneck.
Optimizing Machine Settings for Maximum Output
Reduced speed is often a symptom, not the root problem. Operators may lower rates because they are trying to avoid jams, defects, or unstable operation. If you want more output, study the machine settings that support reliable running instead of simply pushing the line harder.
Repeatability matters. Standardize settings by product where possible, simplify setup steps, and remove unnecessary variation. When settings are easy to apply and more automatic, the process becomes less dependent on individual style. That improves cycle time consistency and supports stronger equipment efficiency.
A practical action for this phase is to compare target speed with actual speed by shift and product family, then investigate the gap. If the line is running slow, ask what issue the team is compensating for. Fix that problem, and output usually rises with less resistance.
Enhancing Line Balancing and Operator Engagement
Performance losses do not always sit inside one machine. In many plants, the production process suffers because upstream and downstream equipment are not balanced well. The result is recurring starved or blocked conditions that limit the bottleneck even when individual assets seem healthy.
That is why line balancing and operator engagement belong together. The people on the shop floor see where flow breaks down, where conveyors back up, and where one process runs faster than the next can accept. Their insight is essential when you adjust speeds and handoffs across the line.
- Review starved and blocked patterns around the bottleneck.
- Balance speeds between connected machines, not in isolation.
- Involve operators in trials and feedback on proposed changes.
These best practices improve manufacturing efficiency because they raise output through smoother flow, fewer interruptions, and more stable teamwork around daily operating conditions.
Month 10–12: Achieving Sustainable Quality Improvements
In the final quarter, shift attention to product quality and the losses that keep you from producing more good parts. Many plants reach this stage and discover that startup defects, scrap, and variation are now the main barriers to higher OEE. That is a good sign. It means earlier work created more stable running time.
The challenge now is sustaining gains while removing quality-related root causes. Months 10 through 12 should standardize best practice, reduce production defects, and prepare the plant for the next improvement cycle.
Implementing Root Cause Analysis on Defects
Quality losses need the same discipline as downtime losses. Start with root cause analysis on the largest production defects, then separate startup defects from steady-state scrap. The causes are often different, so the fixes should be different too. Grouping them together hides the real opportunity.
Startup issues often connect back to changeovers, settings, and repeatability. If the process takes too long to stabilize after a product change, your quality factor will suffer. More consistent setup methods and automated recipes can help reduce that variation.
You should also expect challenges. Some defect causes are obvious, but others require better process understanding and stronger equipment reliability. Stay focused on the system, not the person. When you reduce variation in how the process is set and run, quality improves and the OEE gains are easier to hold.
Standardizing Best Practices to Sustain OEE Gains
Once results improve, standardization becomes the real test. Plants often win a short-term gain, then lose it because the new method never becomes a best practice. Sustained OEE depends on locking in what worked, updating standard work, and making expectations visible by role and shift.
Your oee data should guide this step. If a new setup method reduced startup defects, document it. If a revised cleaning or inspection routine supported preventive maintenance and fewer failures, make it part of the routine. Standard work protects operational efficiency from drift.
- Update procedures for setups, inspections, and loss coding.
- Build successful actions into training for operators and technicians.
- Review adherence during daily management and shift handoff.
Best practices improve manufacturing efficiency because they reduce variation. When the process is more repeatable, you get steadier speed, fewer defects, and more reliable daily performance.
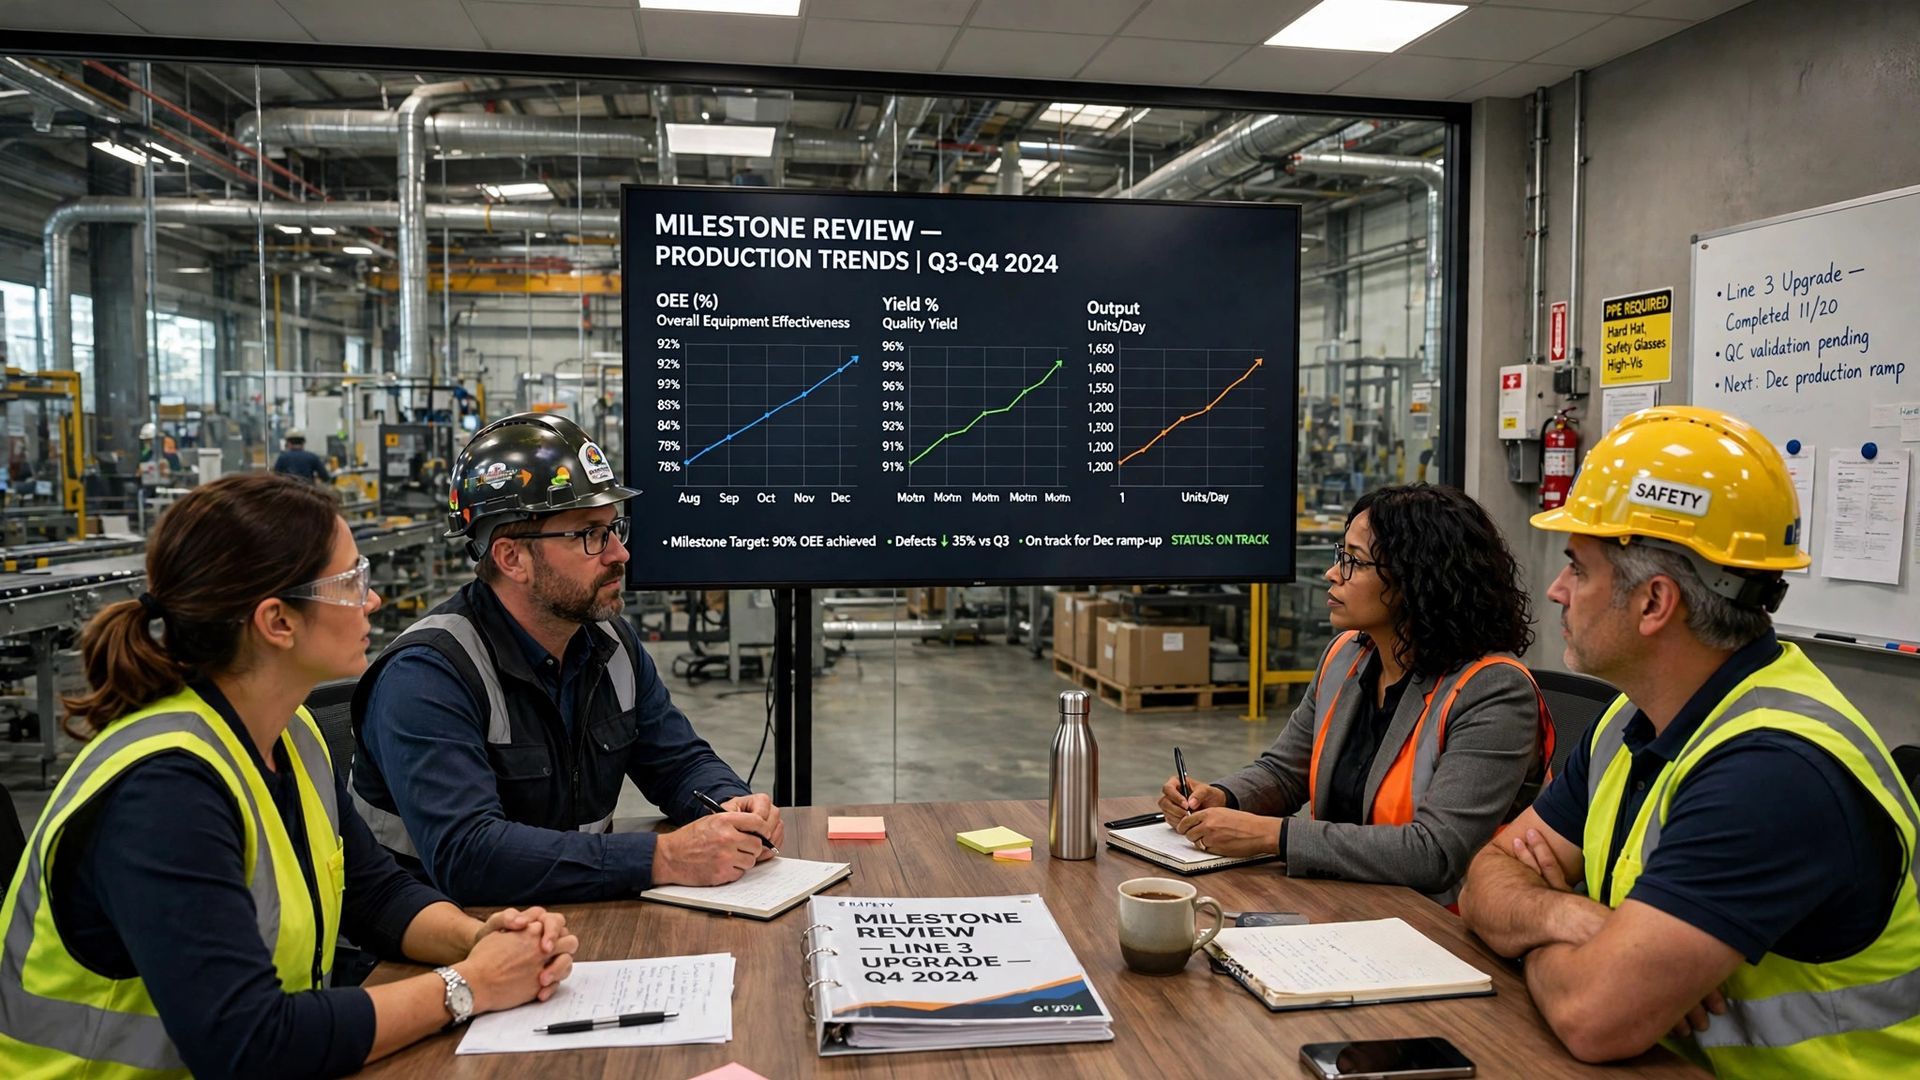
A 12-month plan should end with a formal review, not a victory lap. Quarterly reviews help you compare targets with actual results, confirm what drove improvement, and decide where the next cycle should focus. This is how an oee improvement roadmap becomes part of plant management rather than a one-time project.
Your review should cover each factor in order: Availability, Performance, and Quality. Recheck the baseline, current state, top losses removed, and losses still limiting the bottleneck. Then assign owners and timelines for the next quarter so continuous improvement stays active.
If your data maturity is improving, this is also the point to expand dashboards, historian use, or advanced analytics to support deeper troubleshooting. For a broader framework, you can also review the OEE pillar page at https://www.empoweredautomation.com/oee as your team plans the next stage.
Conclusion
In conclusion, a structured OEE improvement roadmap is essential for transforming your manufacturing processes into world-class operations. By focusing on each phase of the journey—from establishing a robust baseline to tackling availability losses and enhancing performance—you can systematically reduce waste and optimize productivity. Remember, success is not just about achieving the 85% benchmark; it’s also about fostering a culture of continuous improvement within your team. Tracking progress, conducting quarterly reviews, and making adjustments will keep your operations on the right path. For more in-depth insights on OEE, visit our
OEE pillar page to explore strategies that can further boost your plant's efficiency. Start your journey today!
Frequently Asked Questions
What are the most effective strategies for quick OEE improvement?
Start with accurate production data, then rank the big losses by impact. Most plants improve the oee score fastest by reducing downtime, exposing speed losses, and fixing chronic minor stops at the bottleneck. Quick gains come from focused continuous improvement, not broad activity, and that lifts equipment effectiveness faster.
How do I involve my team in the OEE improvement roadmap?
Build an oee improvement team with operators, supervisors, and maintenance teams around the target line. Strong operator engagement matters because the shop floor sees recurring issues first. Keep the focus on the production process, assign owners by loss type, and review results regularly so involvement stays practical.
What challenges should I expect during the OEE journey?
Expect data quality problems early, plus debate over loss definitions. After that, common barriers include equipment downtime, repeat unplanned stops, unstable cycle time, and production defects that seem unrelated at first. Weak preventive maintenance can also slow progress, especially when failures keep returning on the same asset.
You might also like