Fixing Speed Losses: When Equipment Runs Below Rated Capacity
Key Highlights
- Speed loss is a performance loss in OEE that lowers your oee score even when equipment appears to be running.
- In the big losses framework, slow running includes slow cycles and frequent minor stops on the shop floor.
- Many plants focus on downtime first, but slow running often hides larger improvement opportunities.
- Lean manufacturing teams can uncover it by comparing actual rate to target cycle time.
- Better measurement supports continuous improvement and helps expose chronic losses managers often miss.
Introduction
Speed loss is one of the most overlooked drains on overall equipment effectiveness. Your line may be running, parts may be coming out, and still the manufacturing process can be falling short of what the equipment should deliver. That gap matters. It reduces capacity, weakens schedule performance, and can hide behind normal production. If you want a stronger OEE program, start with the performance side. For broader OEE context, see the pillar page at
https://www.empoweredautomation.com/oee.
Understanding Speed Losses in Manufacturing
In OEE, slow running means the line is producing below its intended pace during the manufacturing process. That can show up as slow cycles or as very short interruptions that happen again and again.
From an OEE view, this hits the performance factor, not availability. Your equipment may still be in run mode, but if actual cycle time is worse than expected, output falls and the OEE result drops. That is why slow running quietly impacts overall equipment effectiveness.
Defining Rated Capacity and Performance Factor in OEE
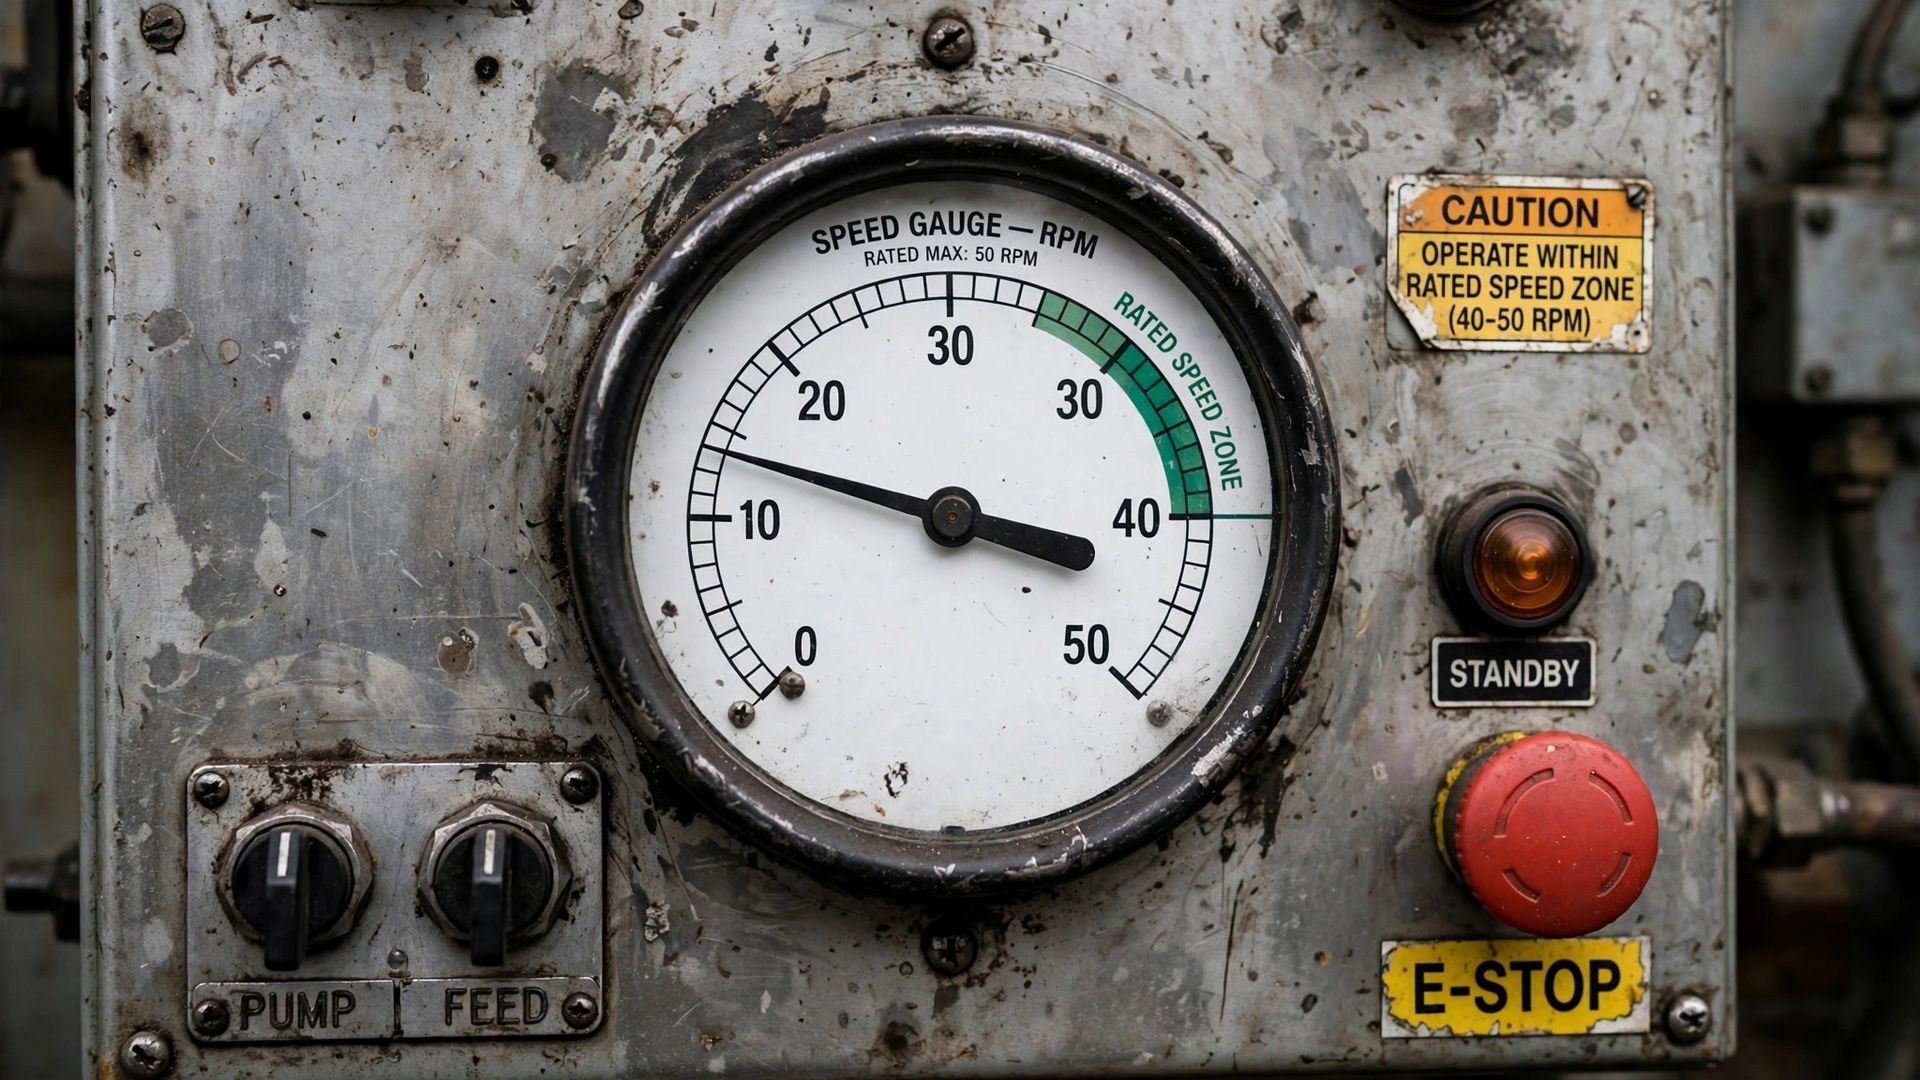
Start with rated capacity. In practice, that means the maximum speed you use as the reference for the asset during production time. Some teams use a theoretical maximum speed. Others use nameplate capacity or a demonstrated rate that protects quality and equipment condition.
The performance factor compares what your machine actually produced against what it should have produced at that reference rate. If the line runs slower than the chosen standard, the gap becomes slow running and pulls down the oee score.
You can also express the same idea through cycle time. If ideal cycle time is set correctly, performance should not exceed 100%. When it does, your maximum speed is probably set too low. Good OEE analysis depends on choosing a realistic but challenging target, then measuring actual output against it consistently.
How Speed Loss Fits into the Six Big Losses Framework
Speed loss sits inside performance loss, one of the main oee loss categories. In the Six Big Losses model, it is not grouped with unplanned downtime, even though some events look like brief stops. That distinction matters because the causes and fixes are usually different.
Here is how the big losses structure breaks it down:
- Availability loss: planned stops and unplanned downtime
- Performance loss: minor stops and slow running
- Quality loss: start-up rejects and production rejects
- Speed loss is the same performance loss bucket many plants miss
Why are minor stops treated this way? Because they are frequent, chronic, and often tied to the same conditions that cause slow speed. On the shop floor, the corrective actions for micro interruptions usually resemble performance improvement work more than classic downtime response.
Identifying Causes of Speed Loss
Once you start looking for slow running, you usually find more of it than expected. It hides in normal operation, between obvious production line stops, and inside daily habits that no one questions.
That is why root cause analysis matters. On the shop floor, speed issues often come from a mix of settings, materials, machine condition, and operating practices. To reduce these oee losses, you need to separate brief interruptions from true slow running and then trace each pattern to its source.
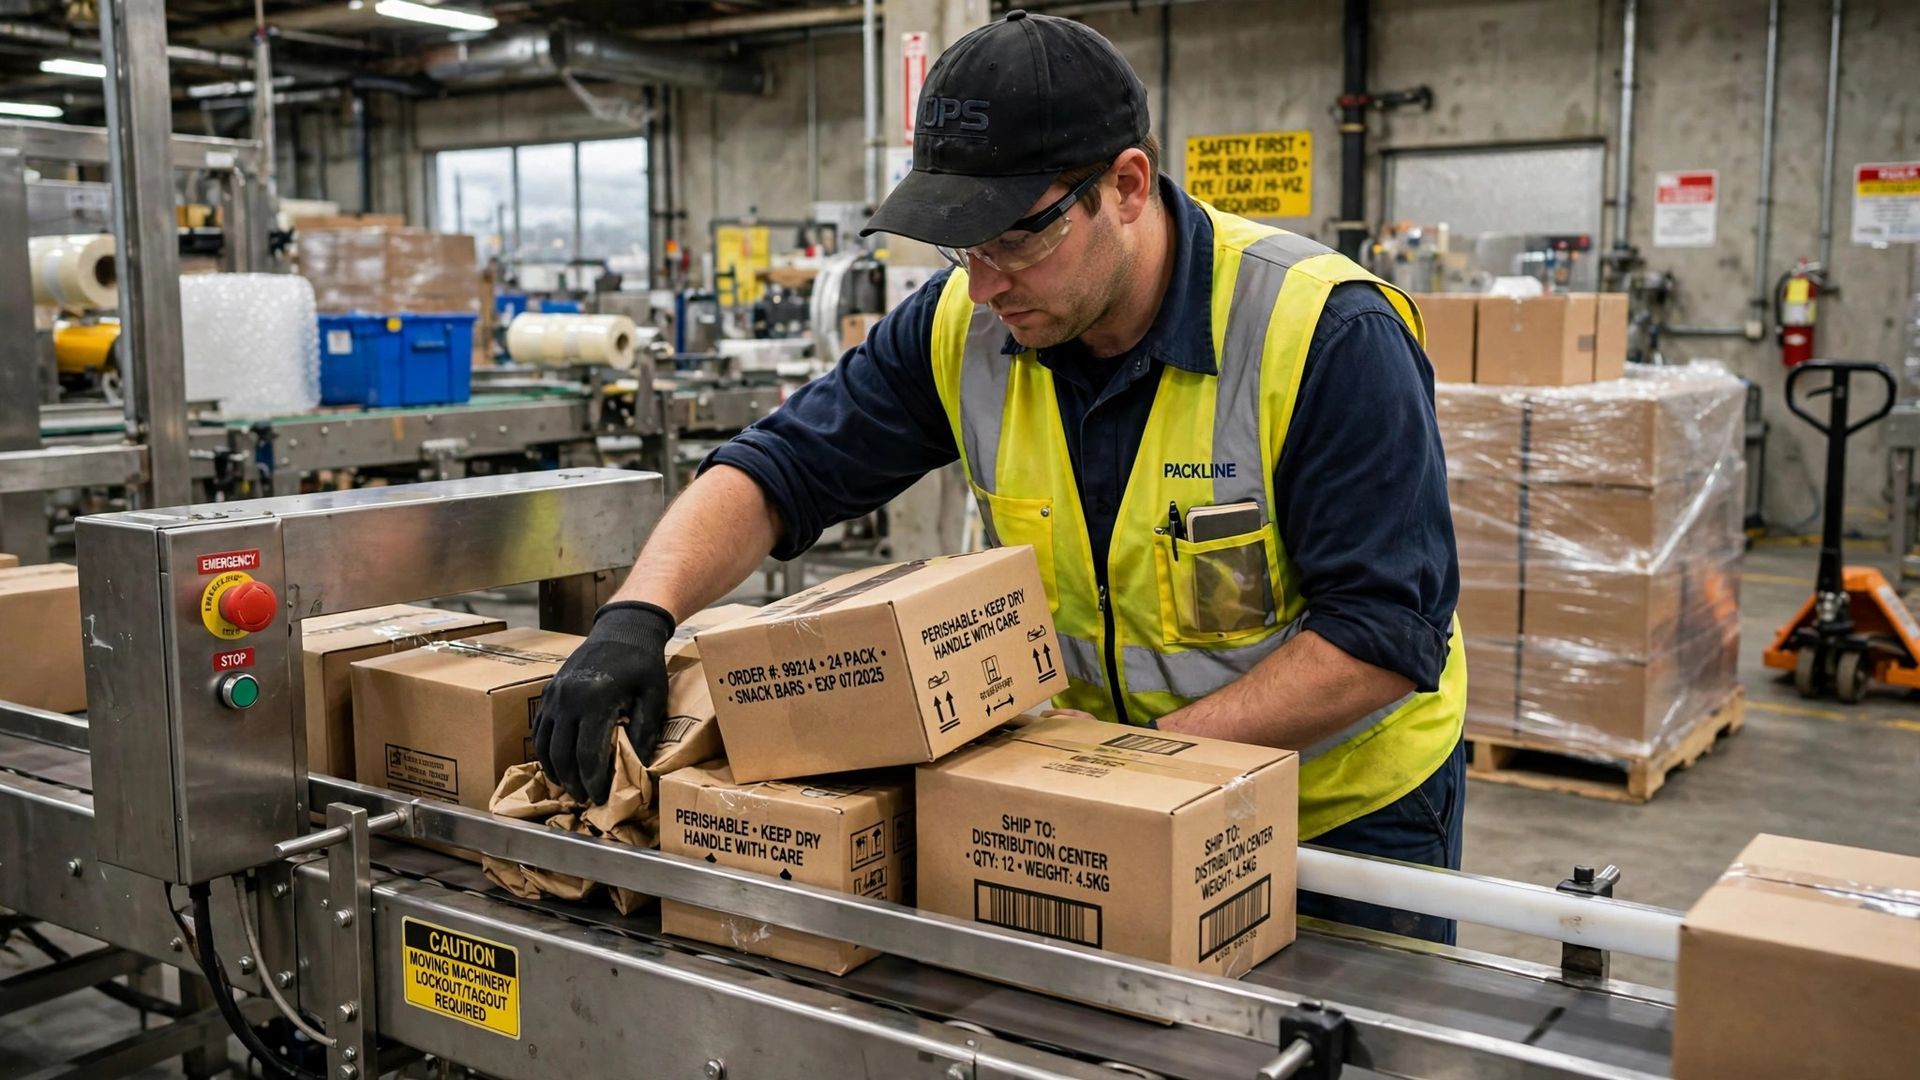
Micro Stops vs. Slow Running Equipment
Not all slow running looks the same. Micro stops are short, frequent interruptions. Slow running equipment stays in motion, but output rate remains below target. Both reduce performance, yet they need different responses.
On most production lines, the distinction becomes clearer when you watch patterns over time:
- Micro stops appear as repeated small stops or minor stops
- Slow cycles show a steady rate below the expected target
- Both can be hidden between larger production stops
Measurement is the key. A simple product-count sensor can estimate whether the issue is stop-and-start behavior or reduced speed. A more reliable method uses hardware or PLC signals to confirm whether the conveyor or machine is actually moving. That extra visibility helps you report slow running in a way operators and engineers can act on.
Common Sources of Speed Loss on the Factory Floor
Many speed problems come from everyday conditions that never trigger a major alarm. Your line still runs, so the loss gets accepted as normal. That is why slow running can stay buried on the shop floor for months.
Common sources include:
- Incorrect settings, poor alignment, blocked sensors, and material mis-feeds
- Equipment design issues, queue limits, and environmental limitations
- Improper maintenance, equipment wear, and weak operator training
Human and product factors also matter. Operators may intentionally slow equipment to avoid quality problems. Material variation, product mix, and scheduling decisions can all reduce rate. This is where total productive maintenance helps. It gives teams a practical structure for restoring basic conditions, improving machine health, and preventing repeat losses before they become part of the routine.
How Speed Losses Impact Overall Equipment Effectiveness (OEE)
Speed losses reduce overall equipment effectiveness by cutting output during run time. The line may look available, but performance loss lowers your actual production rate and leaves throughput on the table.
This is why slow running feels hidden. Unlike a full stop, it rarely gets immediate attention, yet it weakens the manufacturing process hour after hour. If your oee score stalls and downtime is already under control, performance is often the missing piece. The next step is to see how that affects deliveries and cost.
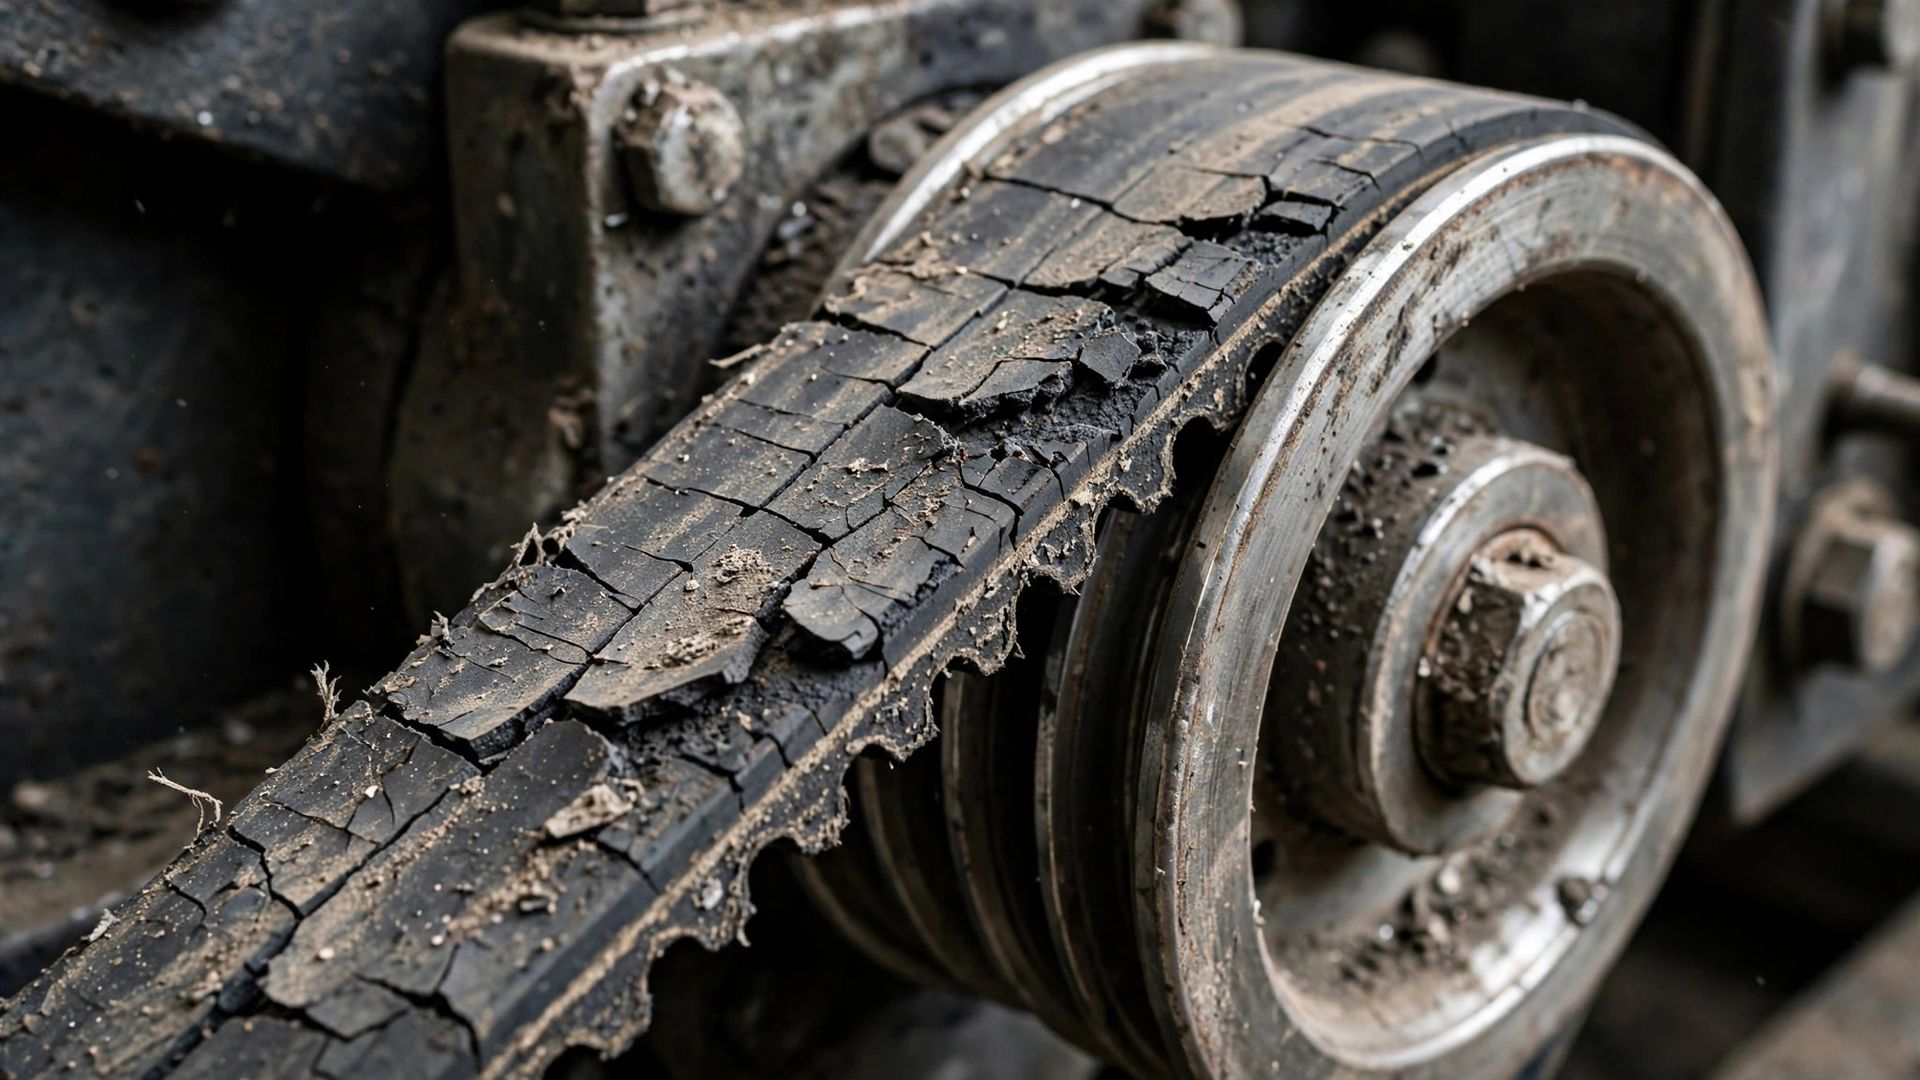
A slower line makes less product during the same scheduled window. That sounds obvious, but the effect on production throughput is often larger than teams expect because the loss repeats every hour, every shift, and every week.
In a capacity-constrained manufacturing process, lower production rate can quickly pressure delivery targets. Orders wait longer, planners have fewer options, and the line has less room to absorb normal variation. Even when inventory or capacity cushions exist, you still lose efficiency.
There is another issue. Because the equipment is technically running, managers may treat the shift as productive. Yet the plant is giving away output it should have captured. When slow running becomes chronic, service levels slip in tight periods and hidden waste grows in periods with more available capacity.
The Hidden Cost of Speed Loss in OEE Calculations
The hidden cost of slow running is that it often escapes attention while still dragging down the oee score. Teams tend to react to visible stops first. Performance loss is harder to see, harder to measure manually, and often understated when targets are set too low.
A simple comparison helps:
OEE loss type
What it looks like
Typical effect
Availability loss
The line is stopped
Lost run time is visible right away
Performance loss
The line runs below theoretical maximum speed
Output falls quietly during production
Quality loss
Bad parts or rejects
Time and material are used without good output
If your production data shows performance above 100%, that is another warning sign. The reference speed is likely too low, which means the plant is underreporting loss. That makes slow running a hidden cause of factory underperformance, even when downtime reports look acceptable.
Measuring and Analyzing Speed Losses
You cannot fix what you do not measure well. Speed loss needs solid production data, a clear reference speed, and performance indicators that operators trust.
In most cases, analysis starts by comparing actual cycle time or output during run time against the chosen maximum. Then you review the pattern for root cause analysis. Is the line stopping briefly, or is it simply running slow? That distinction shapes the action plan and makes the next two choices especially important.
Choosing the Right Maximum Speed for OEE Performance Analysis
Choosing maximum speed is one of the most important steps in performance analysis. You can base it on theoretical maximum speed, nameplate capacity, or a proven rate gathered from actual operation. Each option changes what your oee score reveals.
Theoretical maximum speed exposes more hidden loss, but it may be too aggressive for normal conditions. Nameplate capacity is often safer, yet suppliers may set it low enough that your line can exceed it. That creates the false impression that performance is perfect or even above perfect.
A practical approach is to choose a speed between those points if quality and wear become concerns at the top end. Use observed production time data to confirm what the equipment can sustain. If the standard is too low, performance can exceed 100%, which means the target needs to be reset using better evidence.
Many systems combine both losses into one performance number. That is useful for a high-level view, but it can hide what is really happening on the shop floor. Operators need clearer visibility if they are going to fix the right problem.
There are two practical ways to separate them:
- Count parts with a sensor and use timing patterns to infer micro stops versus slow cycles
- Use motion hardware or machine signals to confirm whether movement actually stopped
- Review events around line stops and production stops to validate the pattern
Why does this matter? Because some slowdowns are intentional and known, while minor stoppages may still need urgent action. A filling line might run slower in warm weather to reduce splashing. A separate report helps you see those planned slow cycles without masking unplanned micro stops that still deserve attention.
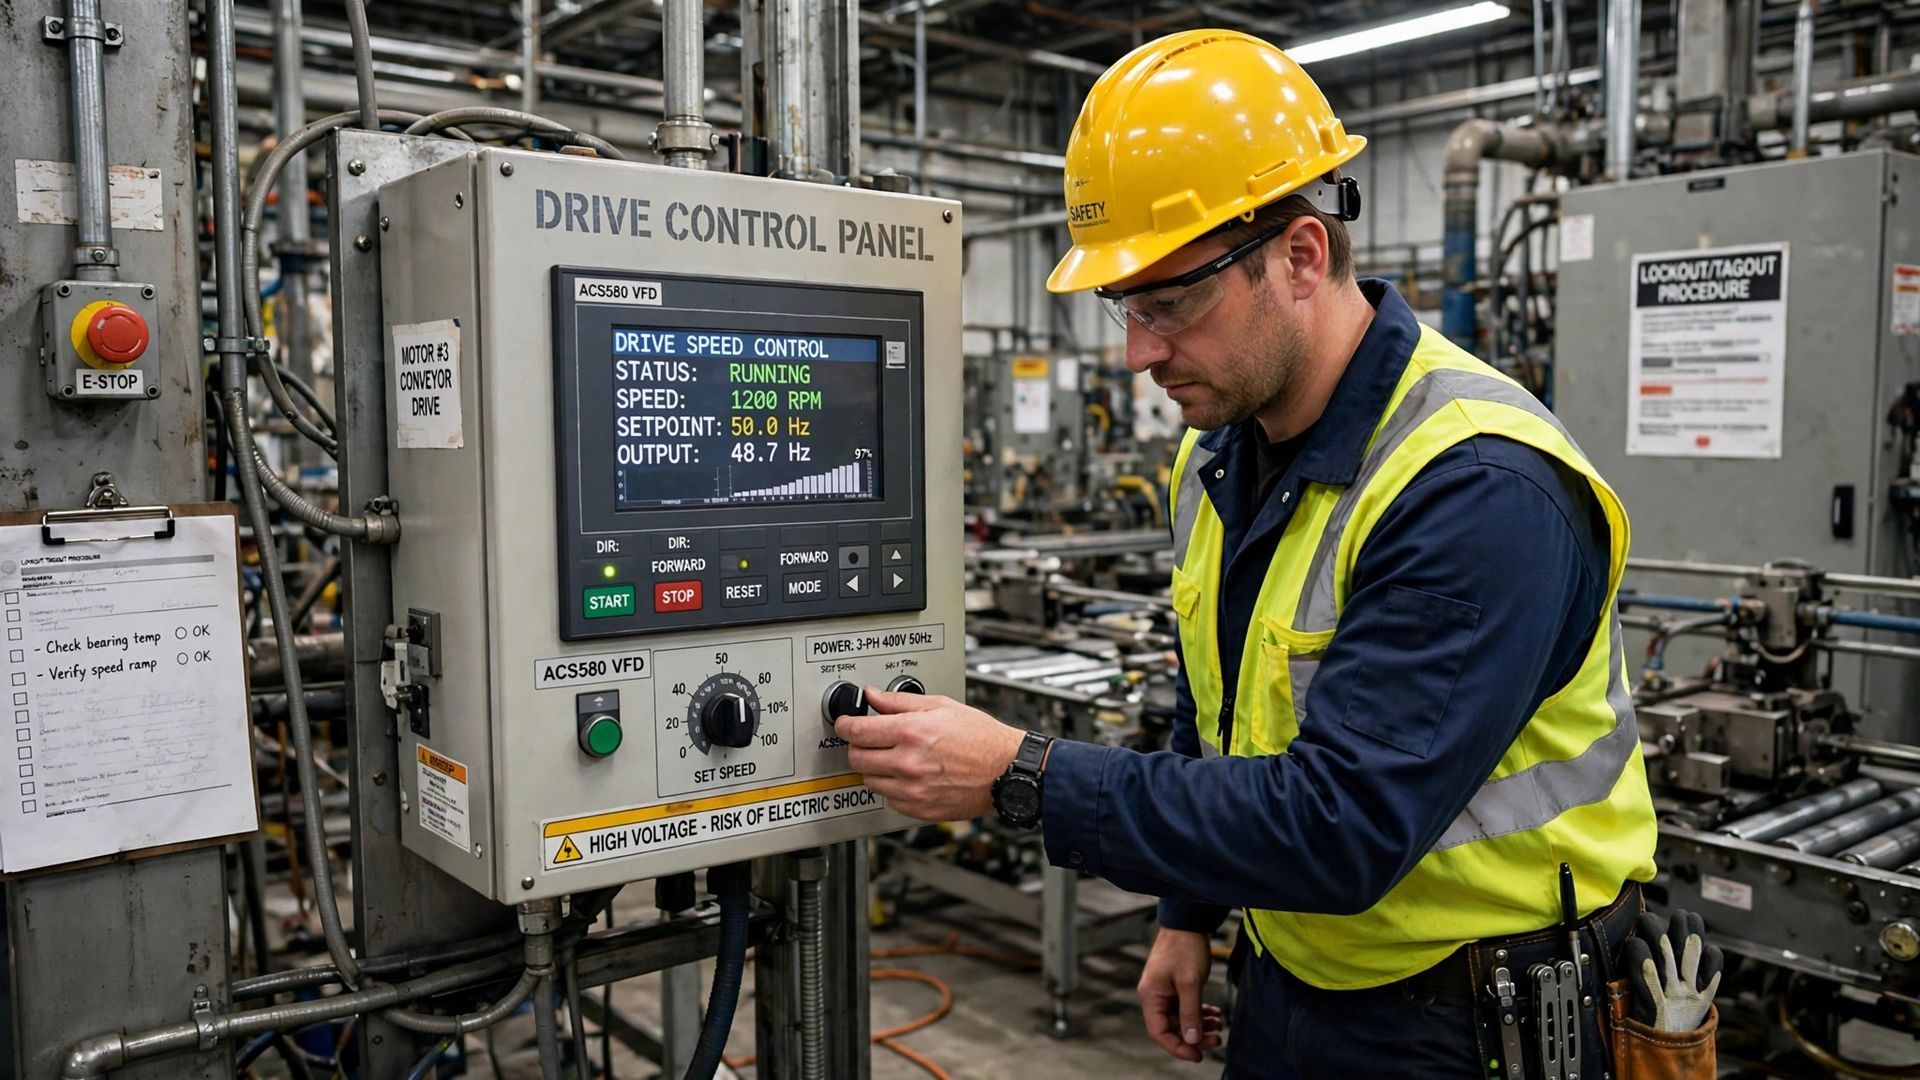
Tools and Technologies for Tracking Speed Loss
Manual tracking rarely captures slow running well because the events are frequent and easy to miss. That is why digital monitoring solutions matter. They improve data collection and make performance visible while the shift is still running.
For production managers, this means fewer guesses and faster response. Systems tied to SAP, machine signals, or other plant tools can support better reporting, while platforms such as TeepTrak Engineer and similar applications show how automated visibility helps teams act before losses become normal.
Benefits of Digital Monitoring Solutions, Including SAP
Digital monitoring solutions make slow running easier to see because they capture events continuously. That matters for performance losses, which are too frequent and subtle for reliable manual logging. When data is automatic, teams spend less time arguing about what happened.
In practical terms, tools connected to SAP or similar systems can help by:
- Bringing real-time data from the shop floor into one view
- Tracking equipment performance against target speed throughout the shift
- Supporting better follow-up on recurring loss patterns
The biggest benefit is consistency. Operators, engineers, and supervisors work from the same signal instead of separate notes. That makes it easier to flag low-speed periods, add reason codes, and build a repeatable process for action. Good digital visibility does not replace problem solving, but it gives problem solving a stronger starting point.
Real-Time Performance Dashboards and Data Collection
Real-time monitoring helps slow running stand out while it is happening, not days later in a report. That is a big advantage for fast lines where small changes in rate can erase a lot of capacity before anyone notices.
Useful performance dashboards usually provide:
- Live production data against target speed or cycle time
- Clear key performance indicators for availability, performance, and quality
- Simple views that highlight repeated slow running periods for follow-up
Strong data collection also supports learning. When operators can tag a range of loss with a reason, the information stays available for the next crew and for engineering review. Over time, dashboards stop being just a display. They become a shared operating tool that helps teams connect visible symptoms with recurring causes and quicker corrective action.
Strategies to Fix and Prevent Speed Losses
Most speed losses can be reduced without major capital if you first make them visible. That is good news for managers trying to improve OEE on existing production lines.
The best results come from a mix of continuous improvement, total productive maintenance, operator training, process improvements, and selective equipment upgrades. Some fixes are simple, such as better settings or alignment. Others require stronger maintenance discipline or a more realistic speed target. The key is matching the fix to the actual cause.
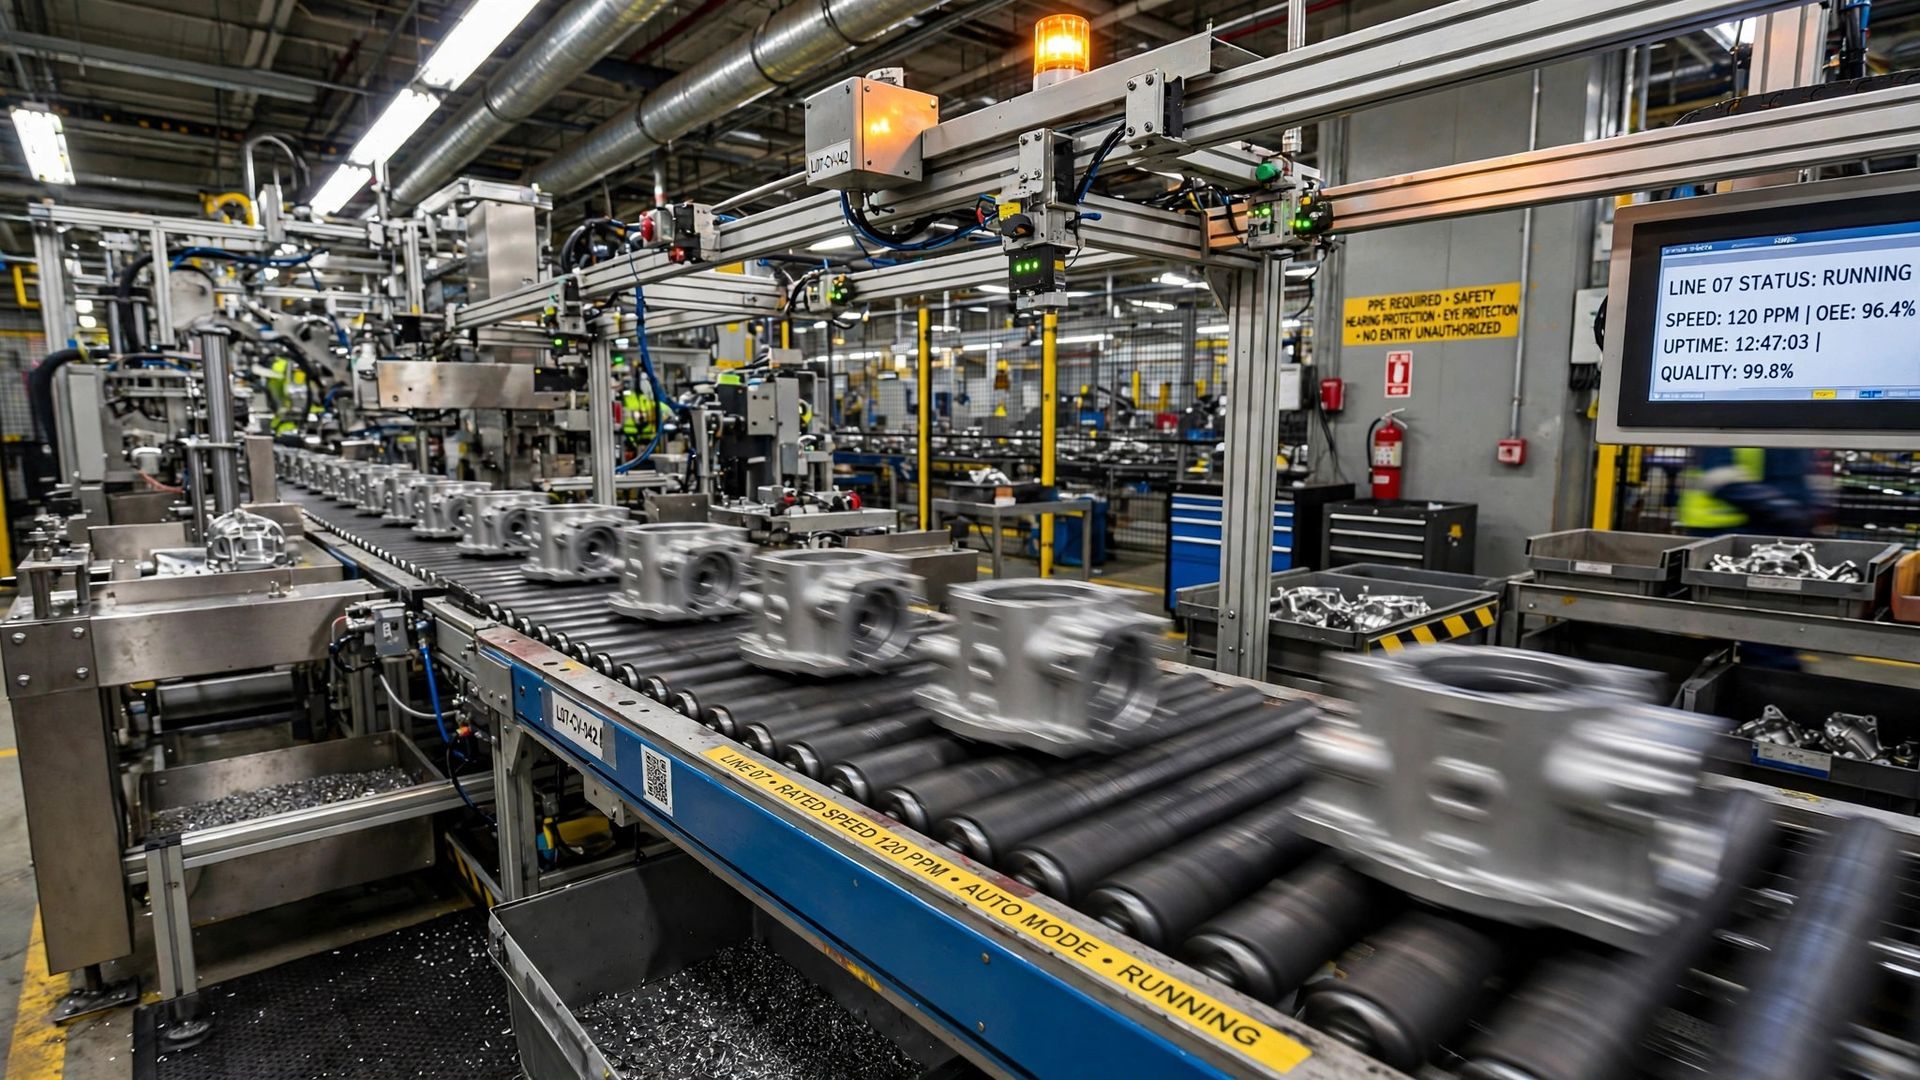
Process Improvements and Operator Training
Start with the basics. Many lines lose speed because standard work is unclear, setup choices vary by operator, or known issues are not documented well enough for the next shift. In those cases, process improvements can deliver quick gains.
Focus your shop floor effort on a few practical actions:
- Improve operator training around settings, alignment, and normal speed conditions
- Use continuous improvement methodologies to review recurring speed patterns
- Capture known causes so teams do not repeat the same mistakes
This fits well with lean manufacturing because the goal is to remove hidden waste from normal operation. Training also helps teams understand why a better speed target matters. When operators know the reason behind the standard and the effect on OEE, they are more likely to react early and escalate issues before slow running becomes the accepted norm.
Maintenance Interventions and Equipment Upgrades
Some slow running comes from worn or unstable equipment. If the machine can only hold target speed for short periods, the issue may be deeper than settings or operator technique. This is where maintenance interventions have the biggest payoff.
Common actions include:
- Correcting improper maintenance and restoring basic machine conditions
- Addressing equipment wear that affects speed stability or repeated jams
- Making equipment upgrades when design limits block sustained improvement
Machine reliability matters because a line that runs unpredictably will always invite slower operating habits. Teams often reduce speed to protect quality or avoid repeated stops. Total productive maintenance helps break that cycle by restoring confidence in the asset. When the machine behaves consistently, operators can run closer to the intended rate without creating new problems elsewhere in the process.
Conclusion
In conclusion, addressing speed losses in manufacturing is crucial for optimizing Overall Equipment Effectiveness (OEE) and achieving production goals. By understanding the causes of slow running, from micro stops to slow-running equipment, you can implement effective strategies to enhance performance. Emphasizing process improvements, operator training, and timely maintenance will not only minimize these losses but also contribute to a more efficient manufacturing environment. Remember, every second counts, and making small adjustments can lead to significant gains in productivity. For a deeper dive into OEE and its components, visit our dedicated OEE pillar page at https://www.empoweredautomation.com/oee. Start transforming your operations today!
Frequently Asked Questions
What is the best method for diagnosing slow running on high-speed lines?
The best method is real-time monitoring backed by solid performance indicators. On high-speed production lines, short events disappear fast, so automatic data capture is critical. Then use root cause analysis to separate chronic slow running from repeated micro stops and tie each pattern to a specific operating, material, or equipment issue.
How do I accurately calculate and report slow running in my OEE system?
Use reliable production data and compare actual output or cycle time against a correctly chosen maximum rate. That reference may be theoretical maximum speed, nameplate capacity, or a demonstrated rate. If your oee score shows performance loss above 100%, reset the target because your standard is likely too low.
Where can I find definitions for key OEE terms related to slow running?
A good starting point is your company’s OEE standard, supported by the broader OEE resource at https://www.empoweredautomation.com/oee. Use it to align terms such as slow running, oee loss categories, the big losses framework, availability, performance, and quality loss so teams report problems consistently across shifts and departments.
speed losses oee
You might also like