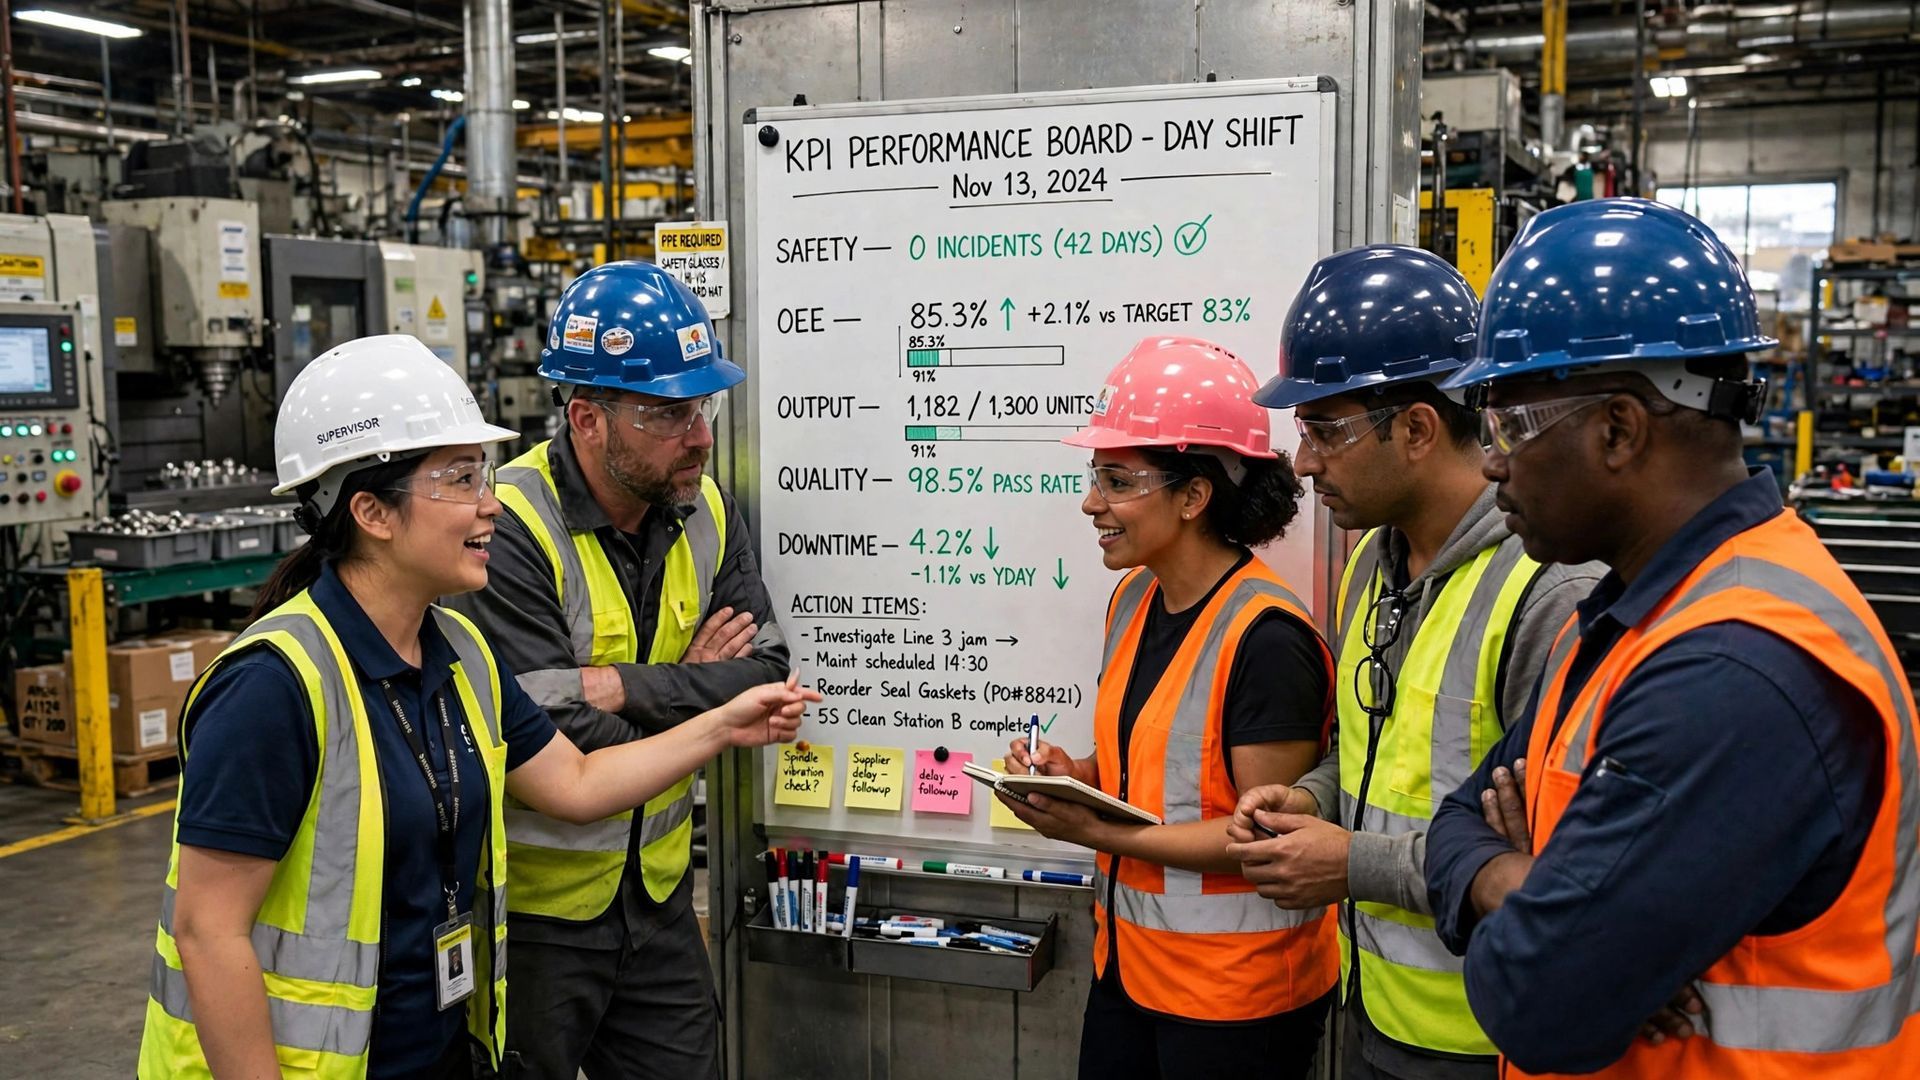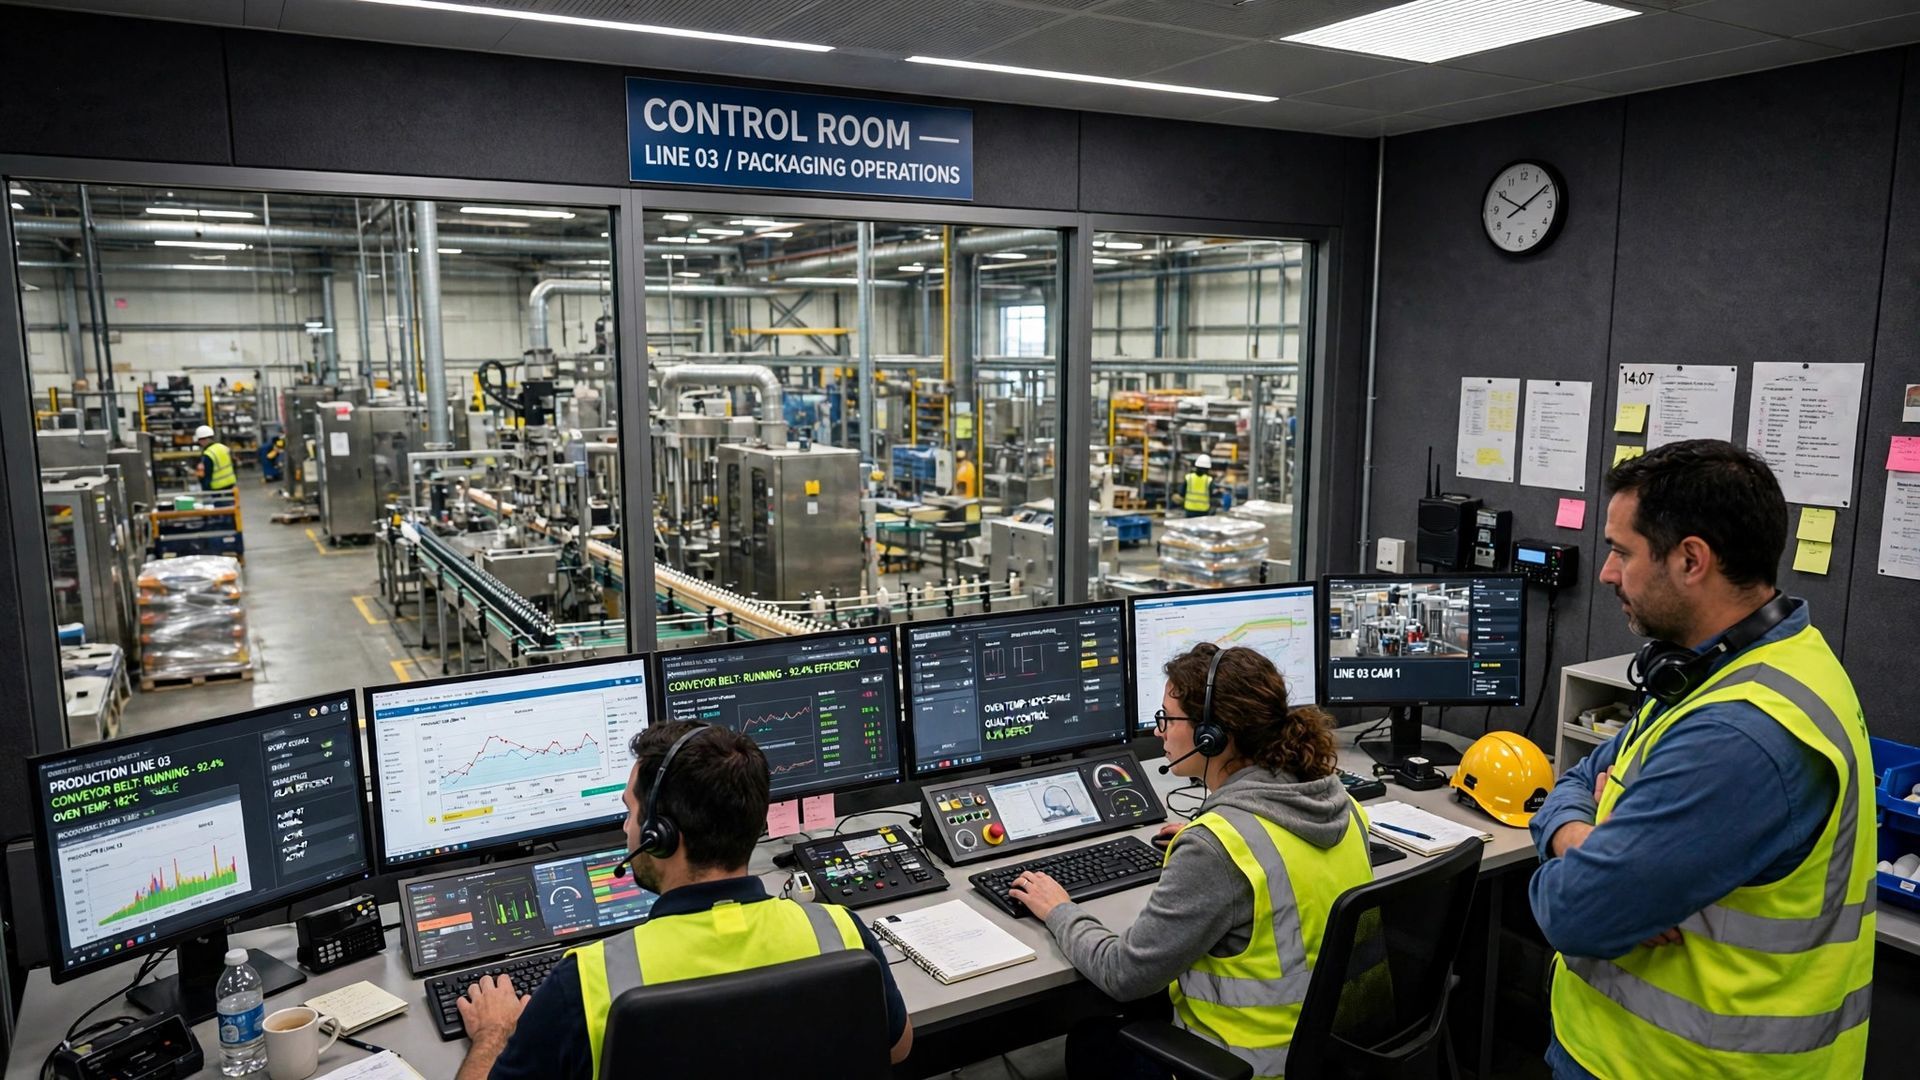
Reducing Defects and Rework: The Quality Factor in Practice
Key Highlights
- In overall equipment effectiveness, the quality factor shows how many good pieces you make in the production process.
- Your oee score depends on three factors: Availability x Performance x Quality, so quality directly changes the final performance metric.
- A simple quality factor formula is good pieces divided by total pieces produced.
- If you make 950 good pieces out of 1,000 total, your quality factor is 95%.
- Scrap, rework, and startup rejects create quality loss and cut fully productive time.
- Continuous improvement starts with better data, defect tracking, and first-pass yield.
Introduction
For plant managers, quality engineers, and production supervisors, overall equipment effectiveness is only useful when it points to action. The quality factor matters because it tells you how much of your manufacturing process actually meets quality standards the first time through. If your line is running fast but producing defects, your OEE result still suffers. That is why quality is not a side metric. It is a direct measure of whether your output is truly productive and ready to ship.
Understanding the Role of Quality in OEE
Quality is the third factor in OEE, after Availability and Performance. In simple terms, it measures how much of your production time produced saleable output. If parts fail inspection, need rework, or end up as scrap, your equipment effectiveness drops even when the machine keeps running.
That is why the quality factor matters so much to your oee score. It separates total output from good output and shows whether your line is creating fully productive time. The next sections break down the formula, the interaction with other factors, and where to find helpful OEE resources.
Defining the Quality Factor in OEE Calculations
In an OEE calculation, the quality factor answers a basic question: out of everything your line produced, how many were good parts? It focuses on pieces that pass through the production process the first time and meet quality standards without repair or touchup.
The practical formula is simple: Quality = Good Count / Total Count. Good Count means pieces manufactured without defects. Total Count includes everything produced, even units that later require rework. This makes the metric close to first-pass yield because it values clean output on the first pass.
From an operations view, that definition is powerful. It turns quality loss into something measurable and actionable. If defects rise, your quality factor falls. If rework increases, your quality factor still falls. That gives supervisors and engineers a clear way to connect product quality to plant-floor performance.
How the Quality Factor Interacts with Availability and Performance
OEE works because it separates loss into three areas. Your availability score reflects lost time from stops. Your performance score reflects slow running and small stops. The quality factor reflects quality loss from defective output. Each one tells you a different story about where production is slipping.
Put together, the formula is straightforward: OEE = Availability x Performance x Quality. That means a strong line speed and high uptime cannot fully offset poor quality. If one factor drops, overall efficiency drops with it.
Here is how the interaction looks on the floor:
- Low Availability means you are not running when you planned to run.
- Low Performance means you are running below maximum possible speed.
- Low Quality means some output cannot be counted as fully productive.
- High OEE requires all three factors to stay strong at the same time.
If your team is building a stronger OEE analysis program, it helps to step back and see how quality fits into the full framework. Quality is only one pillar, even though it often exposes major hidden waste. To see the broader model, visit the OEE overview here: https://www.empoweredautomation.com/oee.
That page is useful when you want to align improvement efforts across maintenance, production, and quality. It also helps teams understand how the three factors work together instead of chasing one problem in isolation.
As you build your system, look for resources that support daily management:
- report templates that standardize shift review
- training guides that explain OEE loss categories
- simple tools that keep data visible for supervisors and engineers
Calculating the Quality Factor Step by Step
Calculating the quality factor does not need to be complicated. In any OEE calculation, you start with solid data collection. You need a total count for everything produced and a good count for the pieces that passed without defects or rework.
Once those numbers are accurate, divide good count by total count. The result shows how much of your output created productive time instead of quality loss. In the next sections, you will see the formula, a worked example, and the most common mistakes that distort this metric.
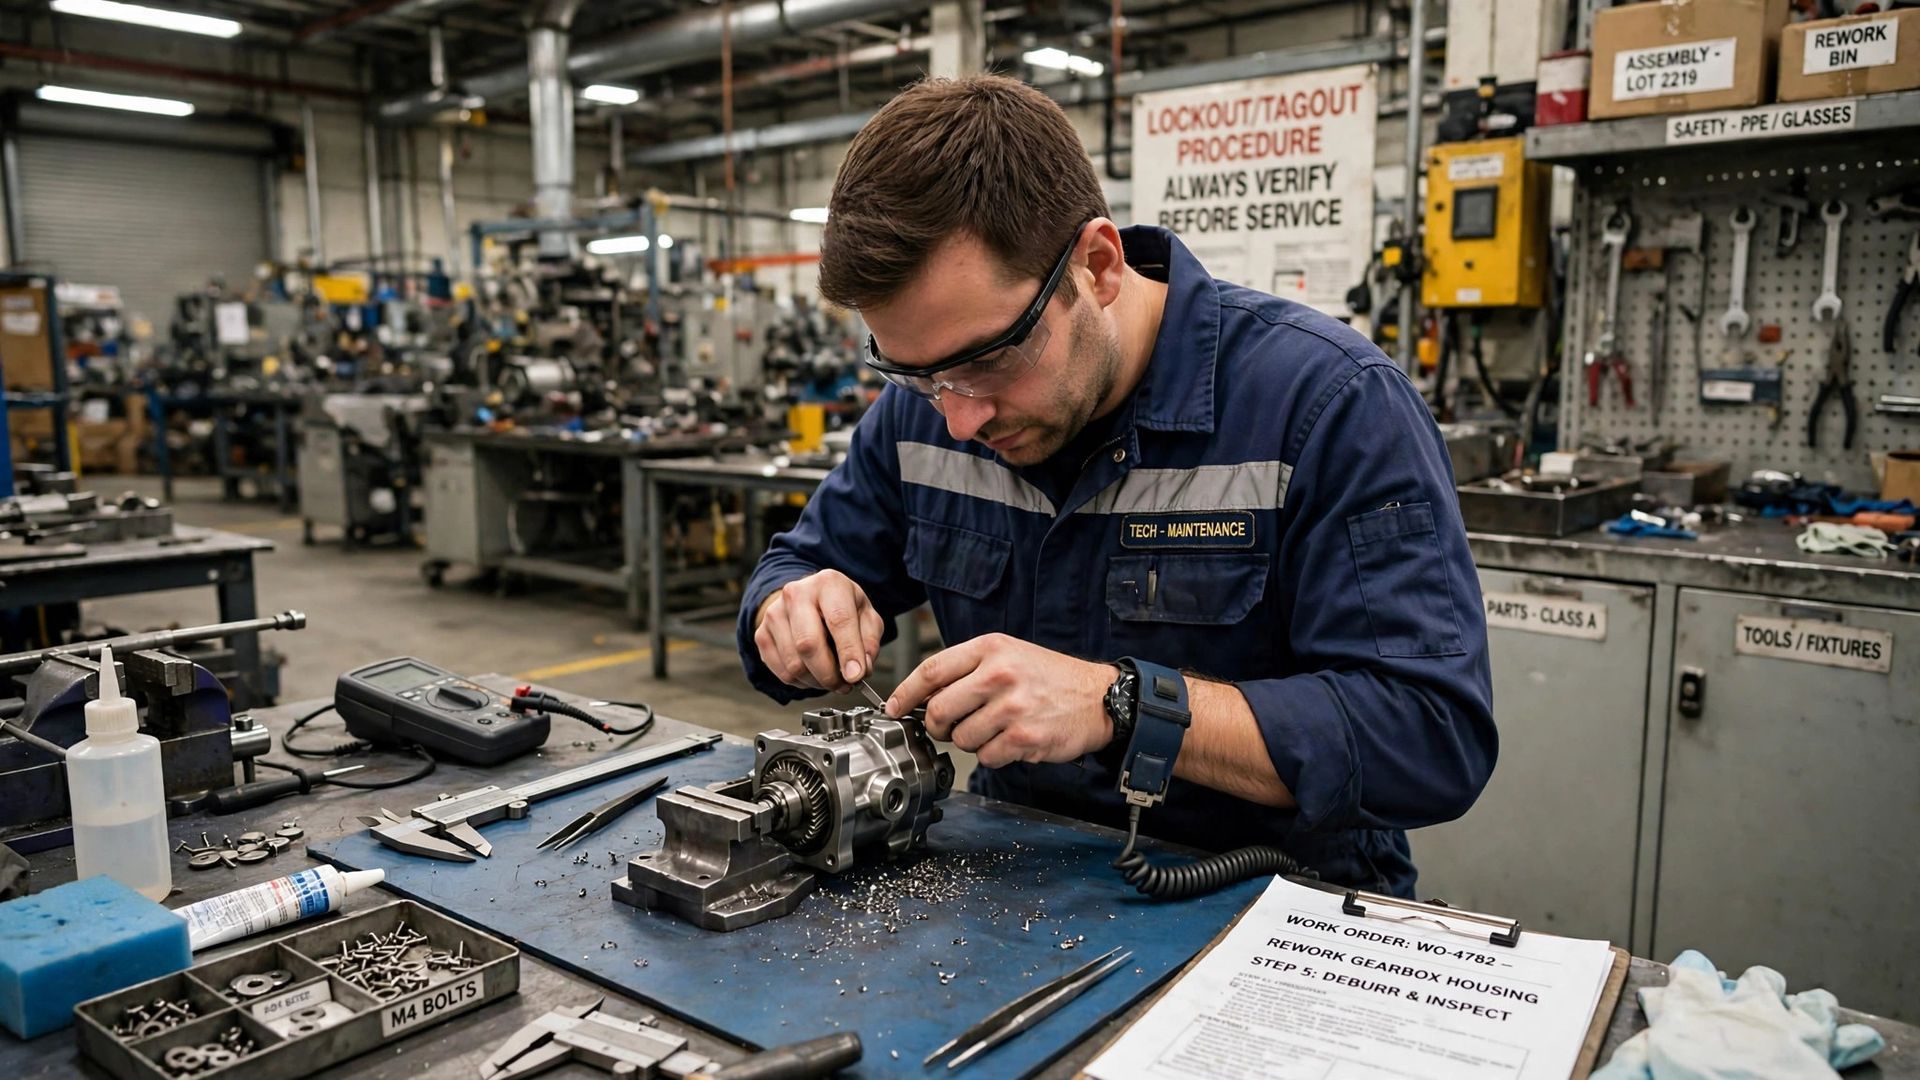
The Formula: Good Pieces Divided by Total Pieces
The formula for the quality factor is one of the simplest parts of any OEE calculation. You take the number of good parts and divide it by the total number of parts produced. That gives you a performance metric for output quality during the run.
Written another way, it looks like this: Quality = Good Pieces / Total Pieces. Good pieces are units that meet requirements the first time. Total pieces include all output, even scrap and units sent to rework. If a part needed correction later, it still counts against quality.
This matters because OEE is about fully productive manufacturing time, not just machine activity. A line can stay busy and still lose ground if too much output fails to qualify as good. That is why the quality factor gives managers a direct read on usable production, not just volume.
Worked Example: 950 Good Pieces out of 1,000
Let’s use a simple example from a production shift. Your line produced 1,000 total pieces. After inspection, 950 were accepted as good units and 50 failed to meet quality standards or required rework. With strong data collection, the calculation is easy and transparent.
Measure
Value
Total pieces produced
1,000
Good pieces
950
Defective or reworked pieces
50
Quality factor formula
Good Pieces / Total Pieces
Quality factor result
950 / 1,000 = 95%
So what does this tell you? Your quality factor is 95%. In the full OEE equation, that 95% becomes the Quality term in Availability x Performance x Quality. Even with a good oee score target, those 50 lost pieces reduce fully productive time and show where improvement should start.
Many quality factor errors come from weak data discipline, not hard math. On a busy production line, it is easy to mix up accepted parts, reworked parts, and scrap. When that happens, the number looks precise but does not reflect reality.
You can prevent most problems by tightening definitions and cleaning up data sources. The quality factor should describe first-pass good output only. It should not change based on opinion, shift habits, or inconsistent paperwork. Clear rules matter just as much as run time accuracy in broader OEE tracking.
Watch for these common mistakes:
- counting reworked pieces as good on the first pass
- relying on manual data entry without verification
- using different data sources for total count and rejects
- excluding startup rejects from quality loss
- failing to standardize defect coding across the line
Types of Defects Impacting Quality
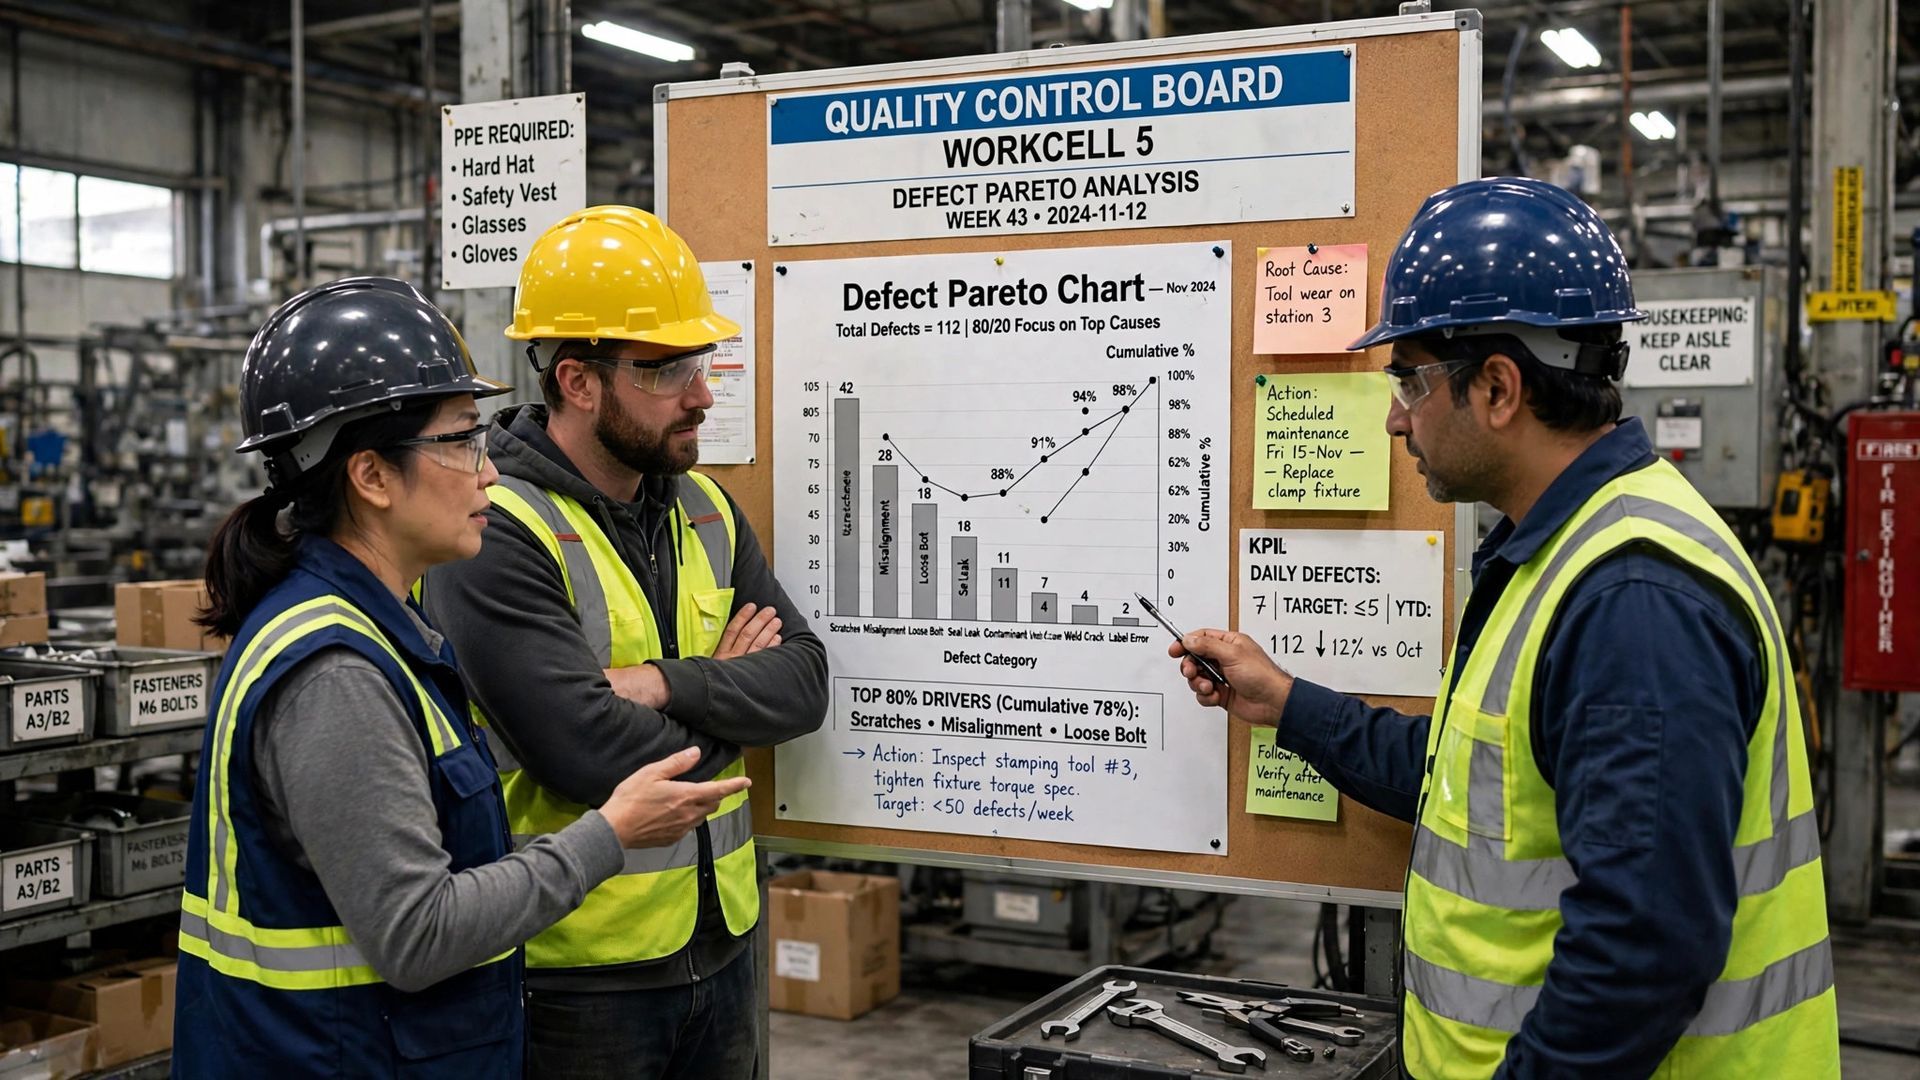
A low quality factor usually comes from recurring defects that create quality loss. For supervisors, the first step is to sort failures into clear defect categories so patterns appear. Without that structure, scrap and rework stay visible as cost but not as a solvable process problem.
Once the categories are defined, your team can connect symptoms to root causes. Some issues come from the process, some from the equipment, and some from startup conditions. The following sections focus on the most common categories, cause finding, and the real impact on metrics.
Common Defect Categories in U.S. Manufacturing
On most U.S. manufacturing lines, defects show up in a few repeatable ways. The key is to define defect categories that fit your operation and match your quality standards. When categories are clear, your production process becomes easier to diagnose and improve.
Some losses are tied to startup conditions, while others happen during steady-state production. The compiled OEE framework points to process defects, reduced yield, scrap, and rework as direct sources of quality loss. Equipment failures can also contribute indirectly when instability creates bad parts.
Common categories often include:
- process defects during normal production
- startup rejects, often called reduced yield
- scrap that cannot be recovered
- parts that require rework to meet standards
- defects linked to unstable equipment or material issues
Used well, these categories help your team move from reaction to focused correction.
Finding defects is only the start. To improve the quality factor, you need root cause analysis that connects each defect pattern to what is happening in your manufacturing operations. The goal is not to sort blame. The goal is to remove repeat losses from the process.
In practice, quality issues often overlap with availability and performance problems. A machine with wear, jams, or instability may run slowly, create defects, and trigger unplanned downtime. Looking at the line this way helps teams avoid treating quality as a separate silo.
Focus your review on causes such as:
- machine wear that affects repeatability
- material shortages or poor material condition
- jams, misfeeds, and other process disruptions
- startup conditions that create reduced yield
Strong improvement efforts begin when the team can tie each defect code to a specific source.
The Cost of Rework and Scrap on Quality Metrics
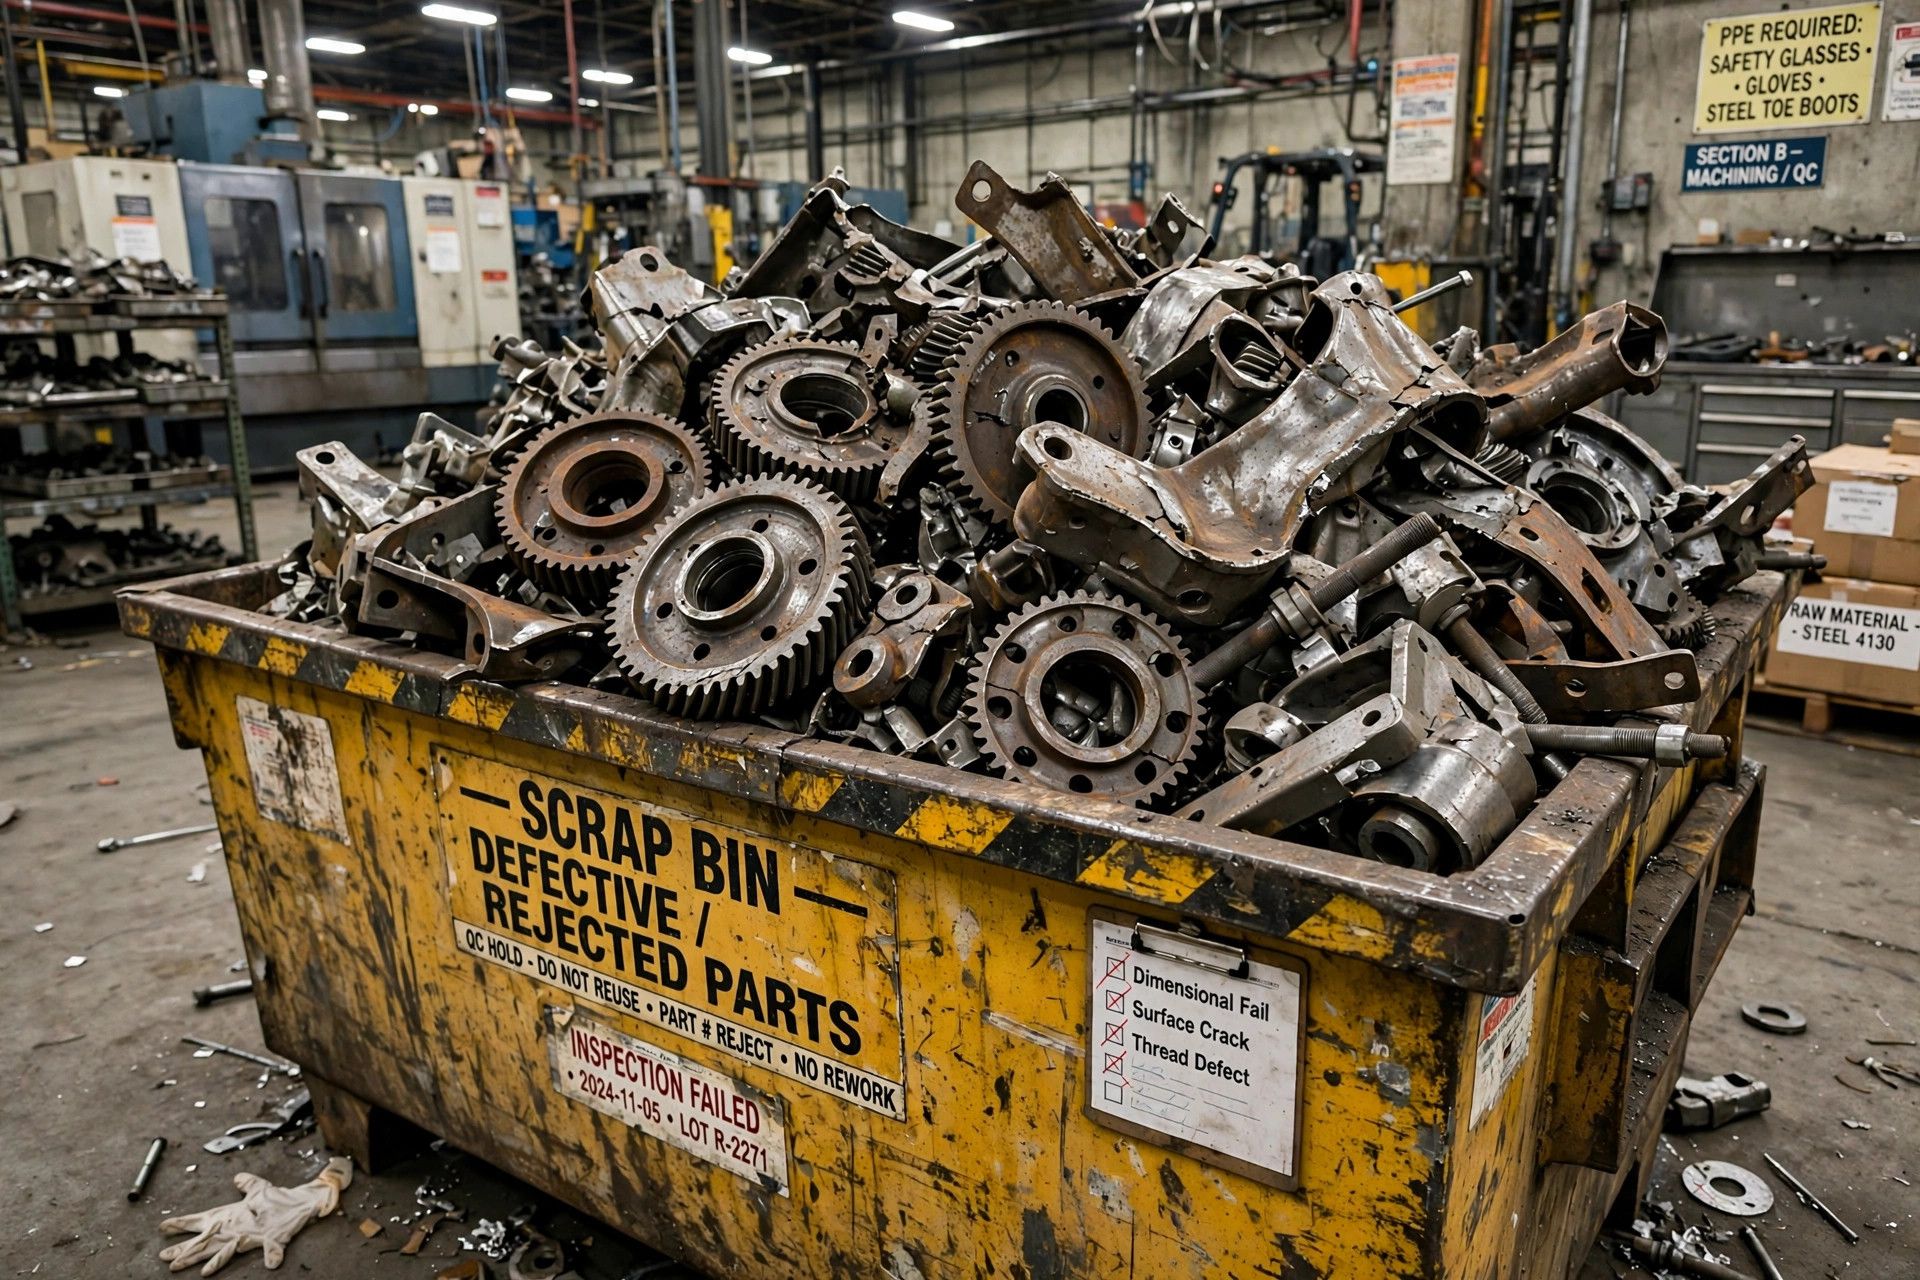
Rework and scrap do more than raise cost. They directly reduce the quality factor because OEE counts only first-pass good output as fully productive. If a unit needs repair later, it may still ship, but it did not pass cleanly through the line. That is quality loss.
This is why rework can hide in plain sight. Your total output may look acceptable, yet the line spent valuable production time making parts that were not right the first time. That lowers effective asset performance and eats into capacity that could have produced saleable units.
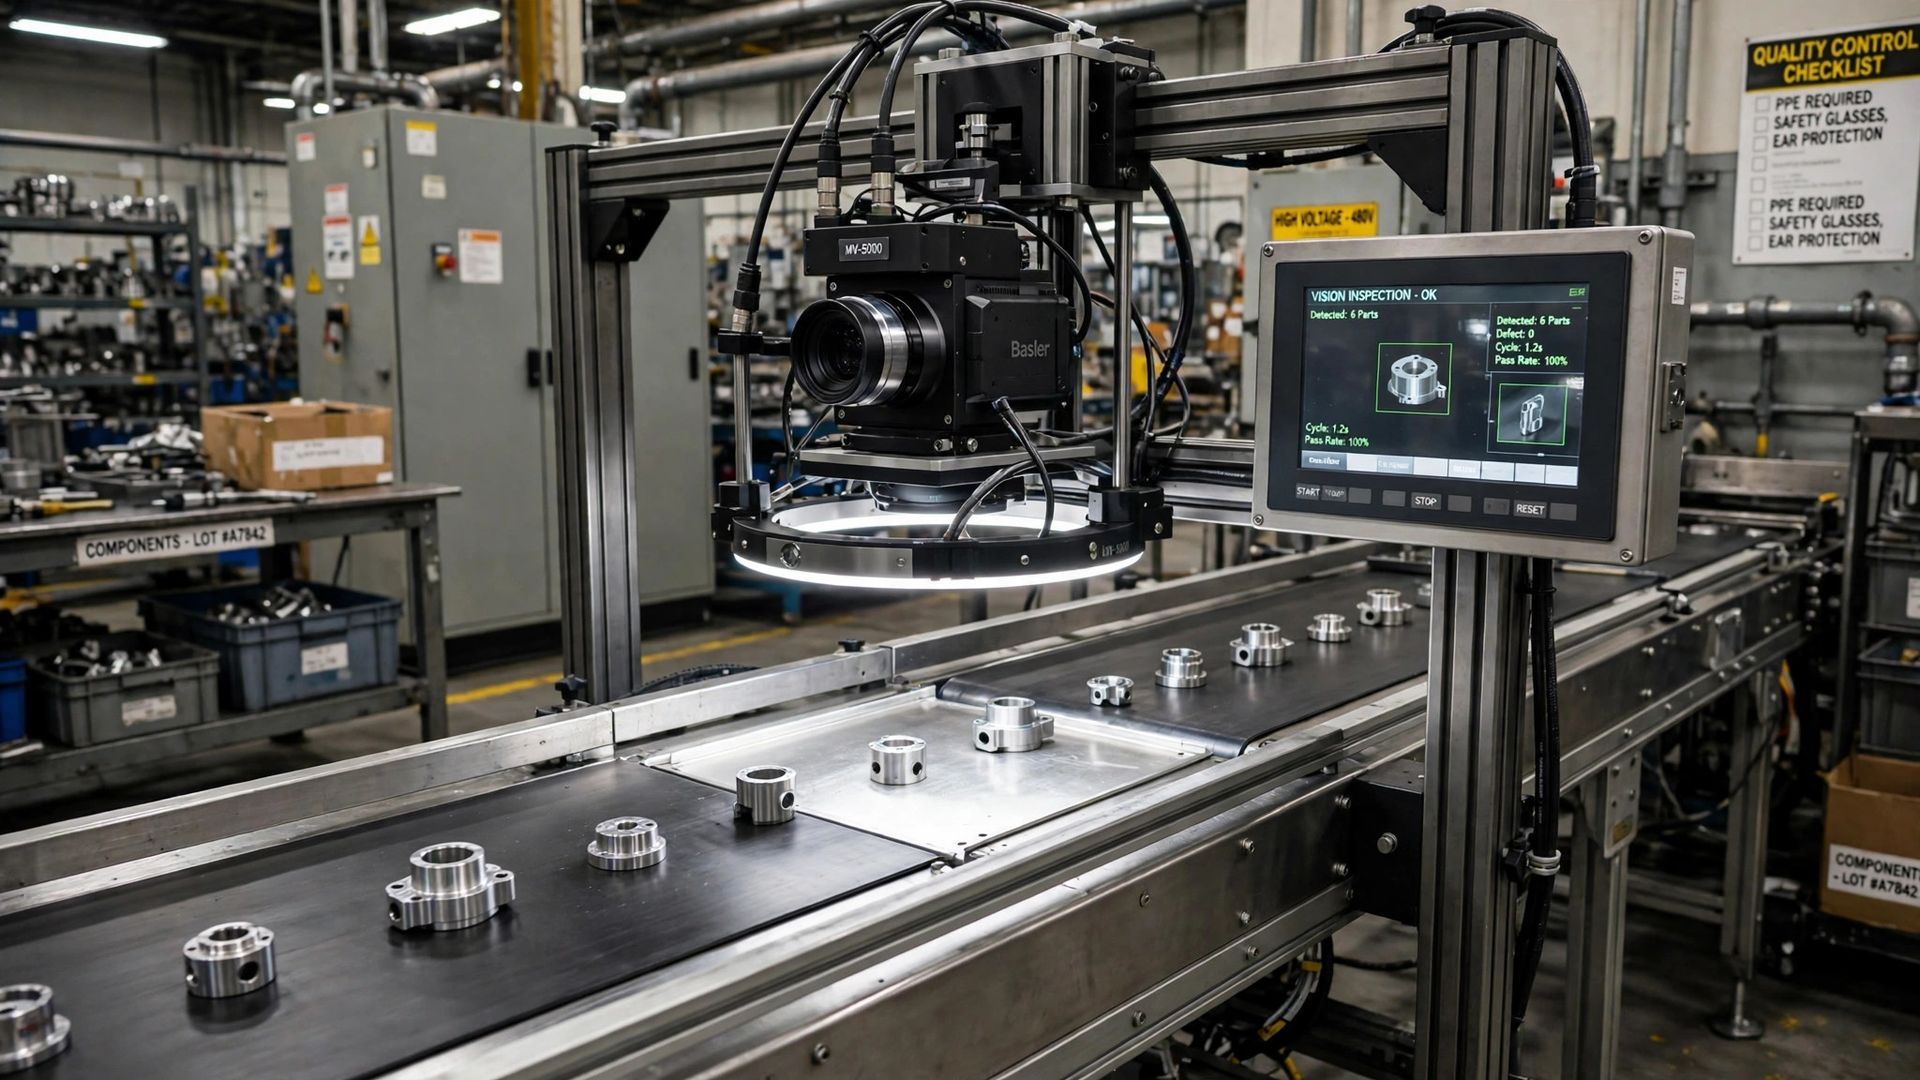
Scrap is even more visible. It consumes material, machine time, and labor with no return. For plant leaders, that means every defect affects both quality metrics and the true productivity of the scheduled run.
Practical Strategies to Improve the Quality Factor
Improving the quality factor starts with better quality control during the run, not just after the shift ends. If you catch drift early, you protect first pass yield and reduce the volume of defects moving downstream. That keeps losses small and easier to correct.
Sustained gains come from continuous improvement built on real production data. For most plants, that means stronger in-process inspection, faster feedback, and disciplined root-cause work. The next two sections cover practical steps that help teams raise first-pass output and hold the gains longer.
Boosting First-Pass Yield with In-Process Inspection
If quality is measured by good pieces divided by total pieces, then first pass yield becomes a daily operating priority. In-process inspection helps because it catches variation before large batches turn into scrap or rework. That supports better quality control without waiting for end-of-line surprises.
For supervisors, the value is speed. You get a quicker signal that the process is drifting, and operators can respond before defects spread. For engineers, it creates cleaner feedback for improvement efforts and tighter alignment with the quality factor in OEE.
Useful practices include:
- checking output during the run instead of only at the end
- separating first-pass good parts from reworked units
- reviewing startup performance for reduced yield
- making defect counts visible by shift and machine
Better inspection timing protects throughput and improves quality at the same time.
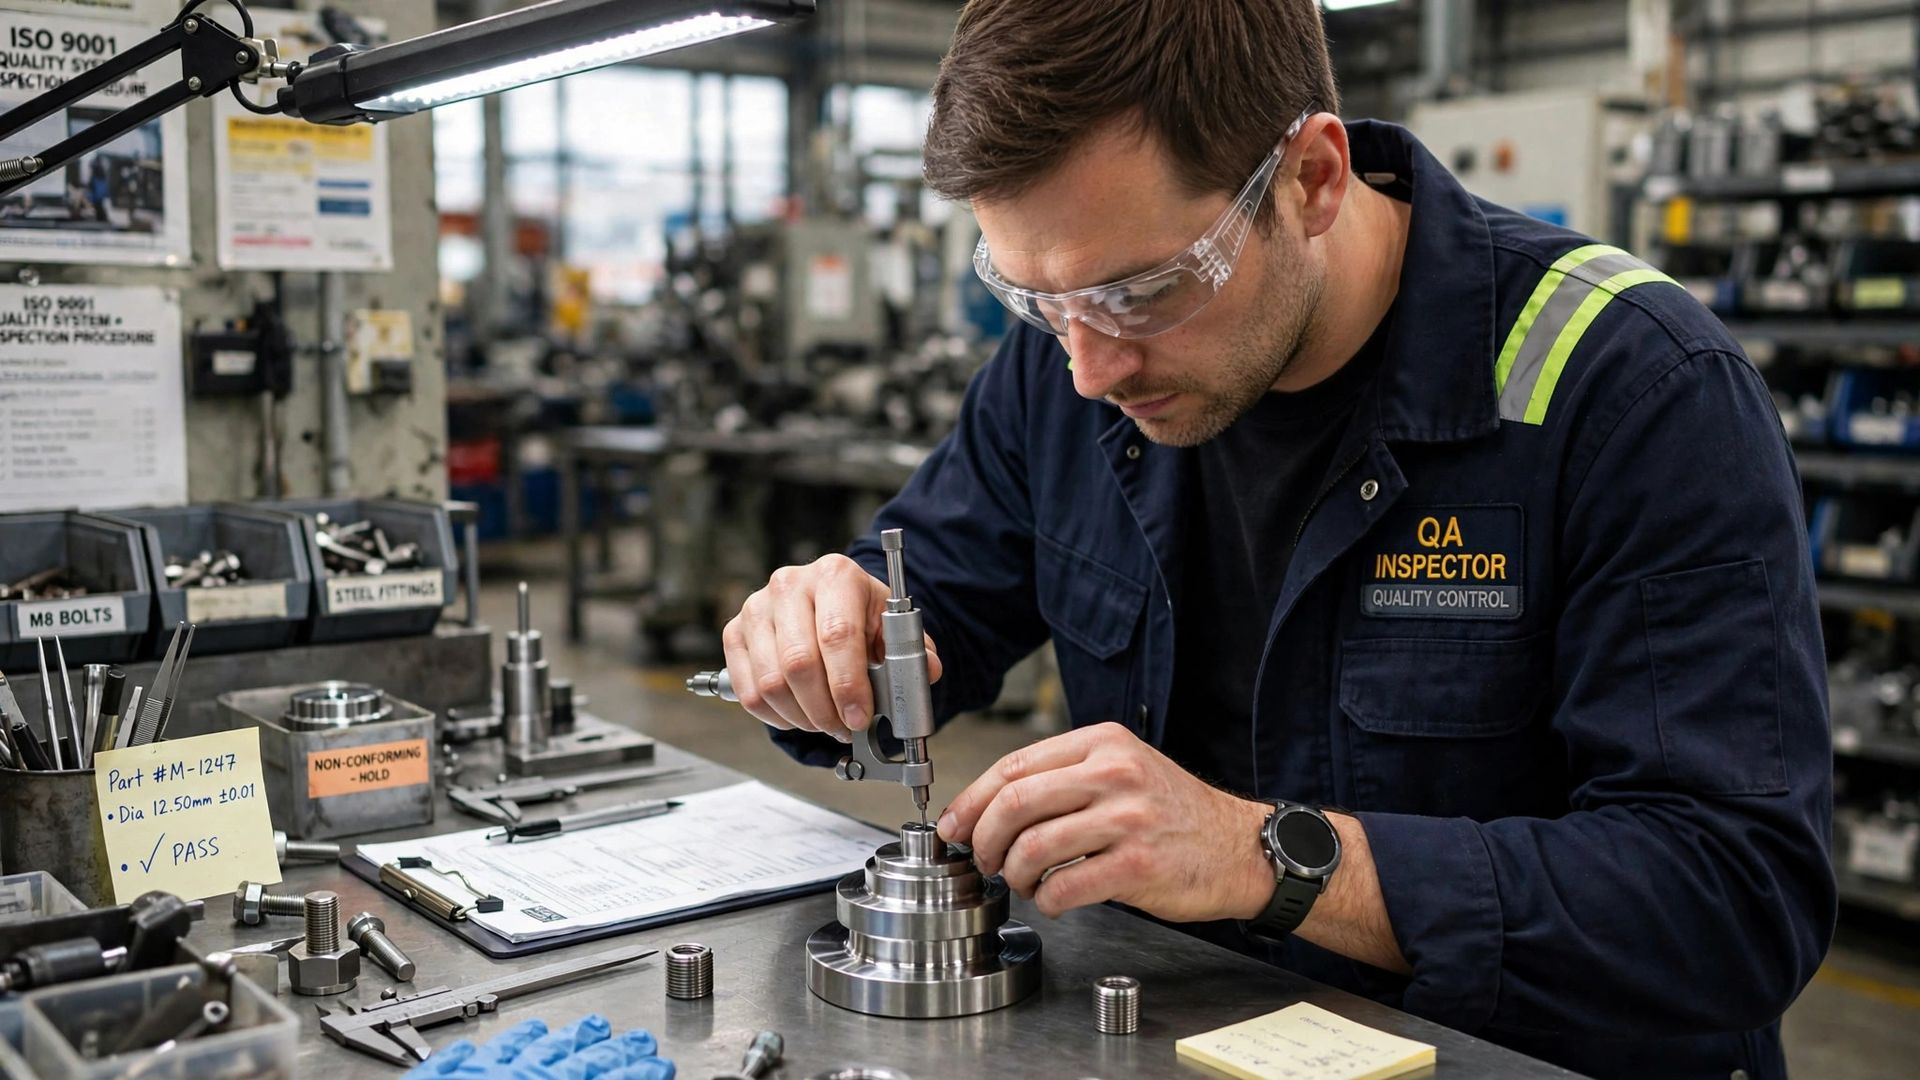
Implementing Root-Cause Analysis for Lasting Improvement
Short-term fixes may reduce defects for a day, but lasting gains need root cause analysis. When you connect each recurring defect to a specific failure mode in the production process, your team can remove the source instead of working around the symptom.
This is also where quality and maintenance should work together. If machine wear, jams, or instability are driving defects, the answer may include predictive maintenance and better upkeep, not just tighter inspection. That keeps quality improvement tied to equipment health and process control.
Best practices include:
- reviewing defect trends with production and maintenance together
- linking repeat quality losses to specific equipment conditions
- confirming that corrective actions actually reduce future defects
That approach helps hold gains and keeps quality from slipping back.
Conclusion
In summary, focusing on the quality factor within OEE is essential for reducing defects and rework in manufacturing operations. By understanding the interplay between availability, performance, and quality, you can drive significant improvements in your overall efficiency. The calculation of the quality factor—good pieces divided by total pieces—serves as a vital metric to gauge your production success. Emphasizing in-process inspections and implementing root-cause analysis will not only boost first-pass yield but also minimize the long-term costs associated with rework and scrap. For further insights and resources, be sure to check out our OEE pillar page
here. Together, let's work towards elevating your production quality and achieving excellence in manufacturing.
Frequently Asked Questions
How Does a Low Quality Factor Affect OEE and Productivity?
A low quality factor pulls down your oee score because OEE multiplies Availability, Performance, and Quality together. In the production process, defects, scrap, and rework reduce overall efficiency and hide lost capacity. It can also signal asset reliability issues when unstable equipment creates repeat quality problems.
What Are Best Practices for Maintaining a High Quality Factor?
Maintain a high quality factor by tightening quality control during production, improving data collection, and separating first-pass good output from rework. Support continuous improvement with clear defect categories, consistent quality standards, and regular review of equipment performance so recurring problems are corrected before they expand.
Are There Industry Standards for OEE Quality Factor in U.S. Manufacturing?
In U.S. manufacturing operations, OEE uses standard factor definitions, including Quality as good count divided by total count. A world class benchmark often cited for overall OEE is 85% in discrete manufacturing, but teams should compare results using common quality standards, consistent report templates, and stable counting rules.
quality factor oee
You might also like