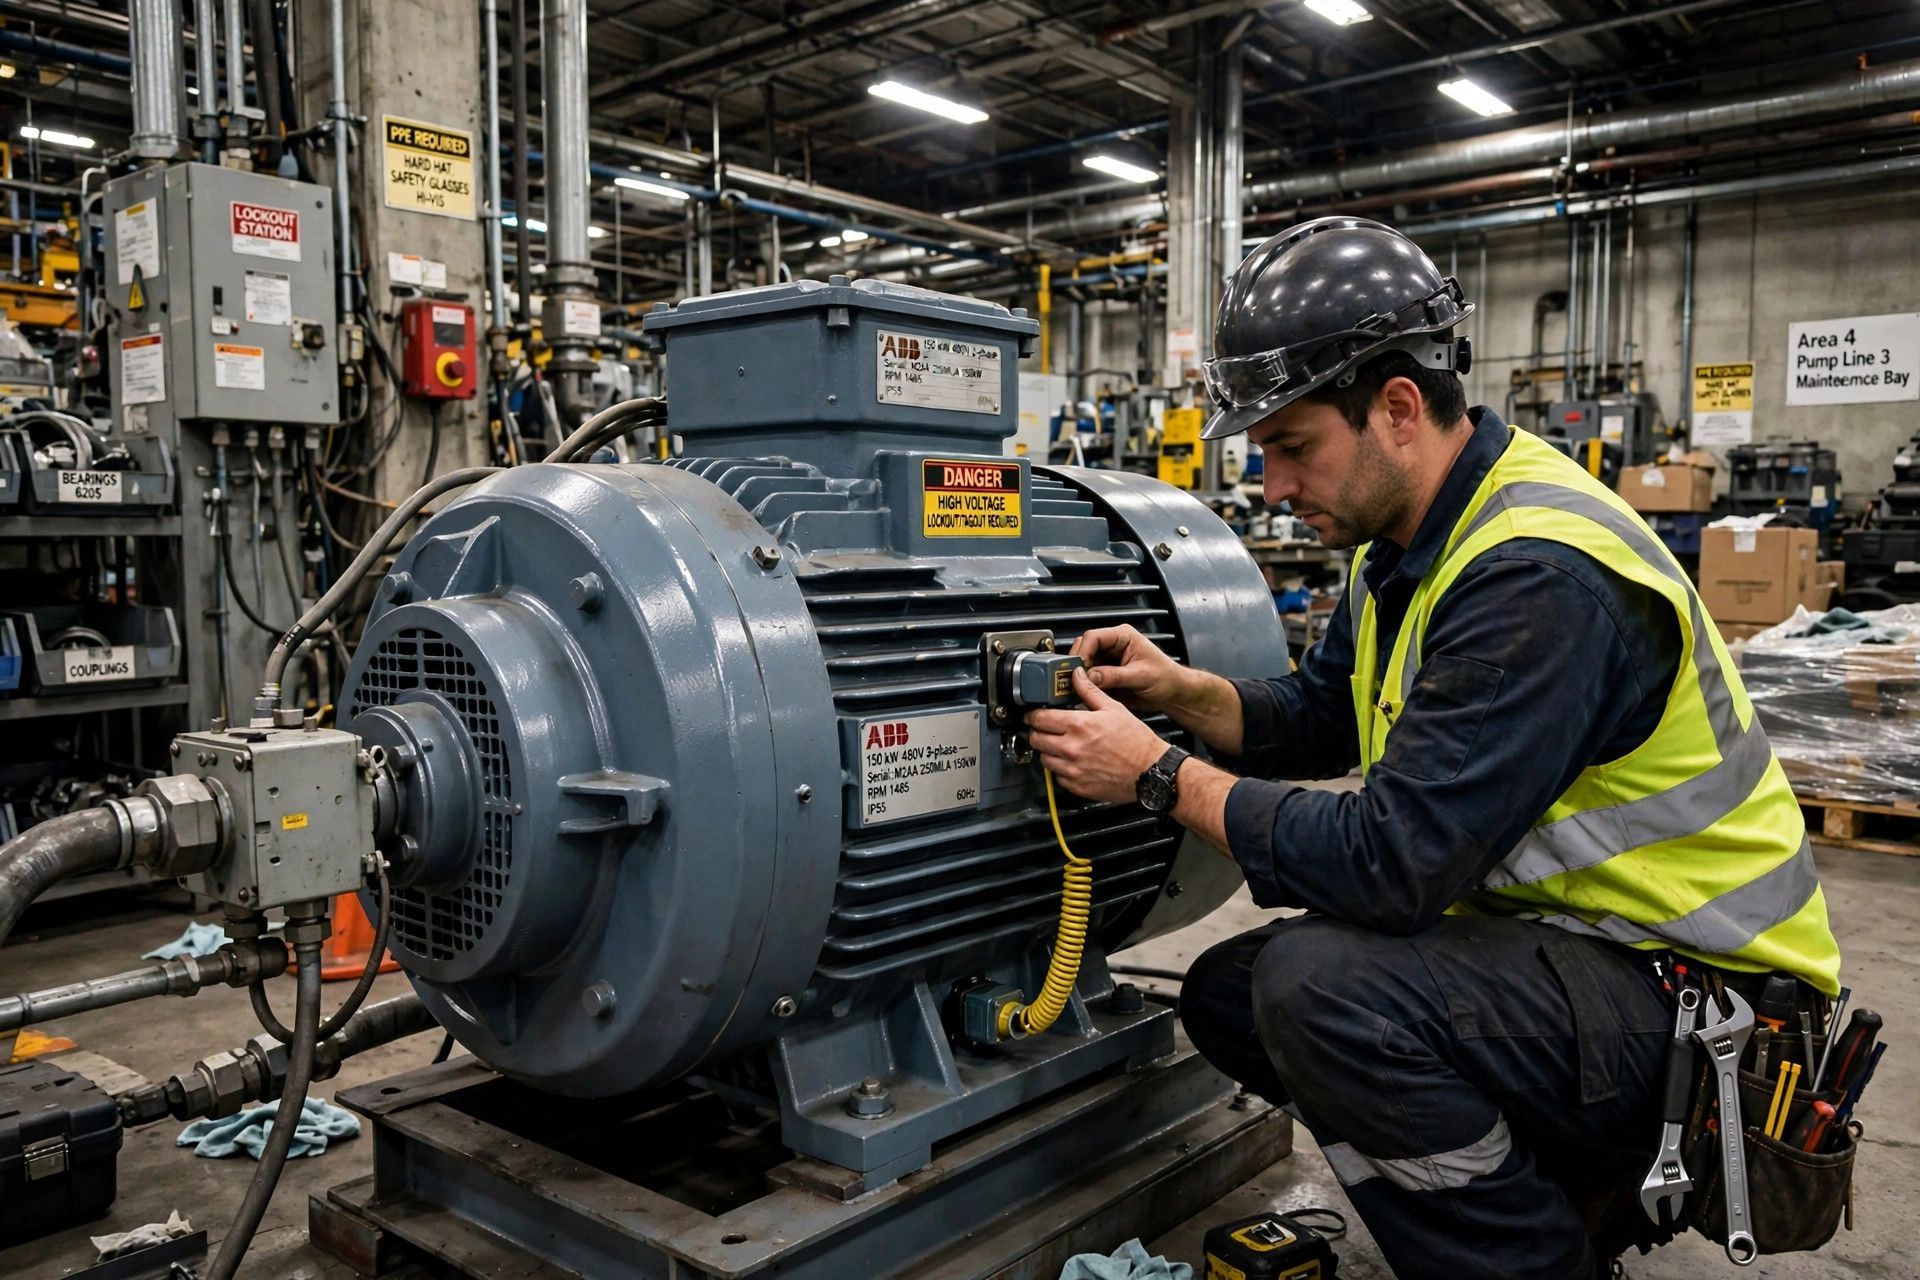
How to Calculate OEE Step by Step: Availability x Performance x Quality
Key Highlights
- Overall equipment effectiveness shows how much planned production time is truly productive.
- The oee formula multiplies Availability, Performance, and Quality into one clear oee score.
- A solid oee calculation helps you spot downtime, slow running, and defects fast.
- Better oee tracking supports manufacturing productivity and smarter continuous improvement work.
- A worked example makes the math simple for managers and engineers on the floor.
- Benchmarks help you judge whether your current score is low, typical, or world class.
Introduction
If you want a simple way to measure how well a manufacturing process is running, overall equipment effectiveness is one of the most useful metrics you can use. It turns production data into a clear picture of lost time, speed loss, and quality loss. The basic oee calculation is straightforward: measure Availability, Performance, and Quality, then multiply them together. For a broader overview of OEE and improvement methods, you can also review the OEE pillar page at https://www.empoweredautomation.com/oee.
Understanding OEE in Manufacturing Efficiency
On most production lines, the biggest losses are not hidden in one place. They show up as stop time, slow cycles, and rejected parts. OEE brings these losses together into one measure of equipment effectiveness that is easy to track.

That matters because oee tracking gives your team a baseline and a benchmark. In a manufacturing process, the oee formula helps you compare assets, shifts, and progress over time. Next, let’s break down what an oee score really measures.
What Does Overall Equipment Effectiveness (OEE) Measure?
At its core, overall equipment effectiveness measures the percentage of planned production time that is truly productive. In simple terms, it tells you how much of your scheduled manufacturing time produced good parts at the best possible rate without stop time.
That is why the oee score matters. It does not just show whether a machine ran. It shows whether the production process ran well. A high score means the asset stayed available, ran near its maximum possible speed, and produced acceptable output.
For managers and engineers, this makes equipment effectiveness easier to act on. You are not guessing where time went. You can see whether loss came from downtime, performance loss, or quality loss. That clarity helps you target the right problem first instead of chasing symptoms across the line.
Why OEE Matters for Productivity and ROI
A useful oee calculation does more than create a percentage. It connects line performance to manufacturing productivity in a way your team can review every shift. Many lines run at about 60% productive time, which means there is often real room for improvement.
From a financial view, that matters because focused improvement efforts usually produce better return on investment than broad, unfocused projects. OEE helps you see where waste is coming from so you can work one major loss at a time.
- It helps compare one asset with another, or one shift with another.
- It gives you a baseline for tracking gains over time.
- It points improvement efforts toward the biggest losses first.
When you use OEE well, you spend less time debating opinions and more time fixing the causes that are limiting output.
KeyTerms: Availability, Performance, Quality
Understanding key terms like availability, performance, and quality is essential for calculating overall equipment effectiveness (OEE). Availability considers planned production time against unplanned downtime, while performance measures actual output against the ideal cycle time. Quality reflects the number of good units produced versus total parts. For example, if your production line runs for 8 hours (480 minutes), producing 400 good units out of 500, the OEE score formula—(availability x performance x quality)—will guide you through effective tracking and improvement. For more information, visit our OEE pillar page here.
The OEE Calculation Formula Explained
The preferred oee formula is simple: OEE = Availability × Performance × Quality. This version of the oee calculation gives you more insight because it shows where the losses are coming from, not just the final oee score.
There is also a simple equivalent form: OEE = (Good Count × Ideal Cycle Time) / Planned Production Time. Both depend on reliable data collection. To use either one well, you need clean counts, accurate stop time, and a realistic ideal cycle time. Let’s break down each factor.
Breaking Down Availability
Availability measures how much of your planned production time was actually spent running. The formula is Availability = Run Time / Planned Production Time. Run Time is simply planned production time minus stop time.
In practice, your availability score captures losses from events that stop planned production for a meaningful period. That includes unplanned downtime such as equipment failures or material shortages. It also includes planned stops such as changeover time when production was scheduled but not running.
So how do you measure it? Start with the total available time that the line was scheduled for production. Then subtract all qualifying stop time. What remains is run time. If you planned for 480 minutes and lost 60 minutes to stops, your run time is 420 minutes, and Availability is 420 / 480, or 87.5%.
Defining Performance
Performance measures whether the asset ran at its best pace during run time. The formula is Performance = (Ideal Cycle Time × Total Count) / Run Time. This tells you how close the process came to its maximum speed while it was running.
A lower performance score usually points to performance loss caused by slow cycles or small stops. The line may stay in motion, but it is still giving away production time. That is why performance often reveals losses that are missed when teams only track downtime.
Here is the key idea: multiply the ideal cycle time by total count to get net run time, which is the theoretical fastest production time for that output. Then compare that with actual run time. If actual run time is much longer, the process is running below its intended pace.
Quality Component in OEE
Quality measures how much of your total count met quality standards. The formula is Quality = Good Count / Total Count. It focuses on good units, not just everything that came off the machine.
This matters because quality loss reduces true output even when the line appears busy. Scrap, rejects, and pieces that need rework all reduce the number of good parts. In OEE, only acceptable production counts as fully productive time.
To measure the quality score, record the full total count and then remove defective units from that number. The remainder is your good count. If the line produced 500 parts and 20 failed quality checks, then good units equal 480. Your Quality result is 480 / 500, or 96%. That number becomes the third factor in OEE.

Step-by-Step OEE Calculation Process
A practical oee calculation follows a simple order. First, collect line data for planned production time, stop time, total count, good count, and ideal cycle time. Then calculate Availability, Performance, and Quality before multiplying them for the final result.
You can do this with manual data entry, spreadsheets, or oee software. The method matters less than consistency. Good oee tracking depends on clear rules for what gets counted and when. The next sections walk through the data and a worked example.
Gathering Data for Availability, Performance, and Quality
Good OEE starts with disciplined data collection. If the production data is incomplete or inconsistent, the final score will be misleading. Your team needs one shared definition for production time, stop events, counts, and ideal rate.
At the line level, gather the numbers in the same sequence every shift. That keeps manual data entry cleaner and makes trends easier to trust over time. Focus on the small set of values needed for the formulas.
- Planned production time, or the total time scheduled for production
- Stop time, including planned stops and unplanned stops
- Run time, calculated as planned production time minus stop time
- Total count and good count, plus the ideal cycle time for the part
Once these inputs are in place, calculating Availability, Performance, and Quality becomes a repeatable routine instead of a once-a-month math exercise.
Example: Calculating OEE with Real Numbers
Here is a worked oee calculation example using one shift. Assume total production time planned was 480 minutes. The line lost 60 minutes to stops, so run time was 420 minutes. Ideal cycle time was 1 minute per part. Actual output was 400 total parts, and 12 were defective units, so good count was 388.
Measure
Value
Planned production time
480 minutes
Stop time
60 minutes
Run time
420 minutes
Ideal cycle time
1 minute per part
Total count
400 parts
Good count
388 parts
Now do the math. Availability = 420 / 480 = 87.5%. Performance = (1 × 400) / 420 = 95.2%, showing some performance loss. Quality = 388 / 400 = 97.0%. OEE = 0.875 × 0.952 × 0.97 = 0.808, or 80.8%. If you want more OEE guidance and context, the pillar page at
https://www.empoweredautomation.com/oee is a useful next step.

Interpreting Your OEE Score
Once you have the number, the next question is simple: is it good? An oee score is most useful when you treat it as both a benchmark and a baseline. It helps you compare today’s result with industry ranges and with your own recent performance.
For discrete manufacturing, the common reference points are widely used in oee tracking. They are not the whole story, but they give you a practical frame for continuous improvement.
- 100% means perfect production: good parts only, at top speed, with no stop time.
- 85% is often viewed as a world-class level.
- 60% is fairly typical and signals clear improvement opportunity.
If your score is around 40%, that is low but often very fixable. Start by attacking the biggest stop time reasons one at a time and build from there.
Practical Tips for Accurate OEE Measurement
Accurate oee tracking depends on clean definitions and consistent habits. If your team changes what counts as stop time or quality loss from shift to shift, the oee calculation will drift and lose value.
That is why many plants combine standard work with oee software and total productive maintenance practices. The goal is not just better math. It is better decisions. Before you set targets, make sure the measurement method itself is stable and trusted.
Common Mistakes to Avoid When Calculating OEE
Most OEE errors are not caused by hard formulas. They come from inconsistent data collection and unclear shop rules. This is especially common when teams rely on manual data entry across multiple operators or shifts.
Another issue is incomplete loss reporting. If small stops, changeovers, or defective units are missed, the number may look better than reality. That makes the oee calculation less useful because the losses are still happening even if they are not recorded.
- Forgetting to record all qualifying stop time
- Counting reworked or defective units as good output
- Using an unrealistic ideal cycle time
- Mixing planned downtime rules between shifts
- Entering counts late or inconsistently during manual data entry
The fix is simple: define each input once, train the team, and review exceptions often. Reliable OEE comes from disciplined routines, not guesswork.

Tools & Calculators for OEE in the US Manufacturing Sector
You can calculate OEE with a spreadsheet, but many plants move to dedicated oee software as soon as they want faster updates and less manual work. Automated tools reduce data entry errors and give managers real time visibility into line performance.
One example mentioned in the source material is Vorne XL, which is positioned as a simple way to monitor and improve production. The same source highlights quick deployment, automated data capture, and broad use across many installations. For teams comparing options, that points to a practical path beyond paper logs.
- Spreadsheet-based oee calculators for basic line reporting
- OEE software for automated data entry and real time tracking
- Vorne XL for production line monitoring and improvement support
- Training guides and templates to standardize plant reporting
The best choice depends on how often you calculate, how many assets you track, and how much consistency you need across shifts.
OEE Benchmarks and Industry Standards
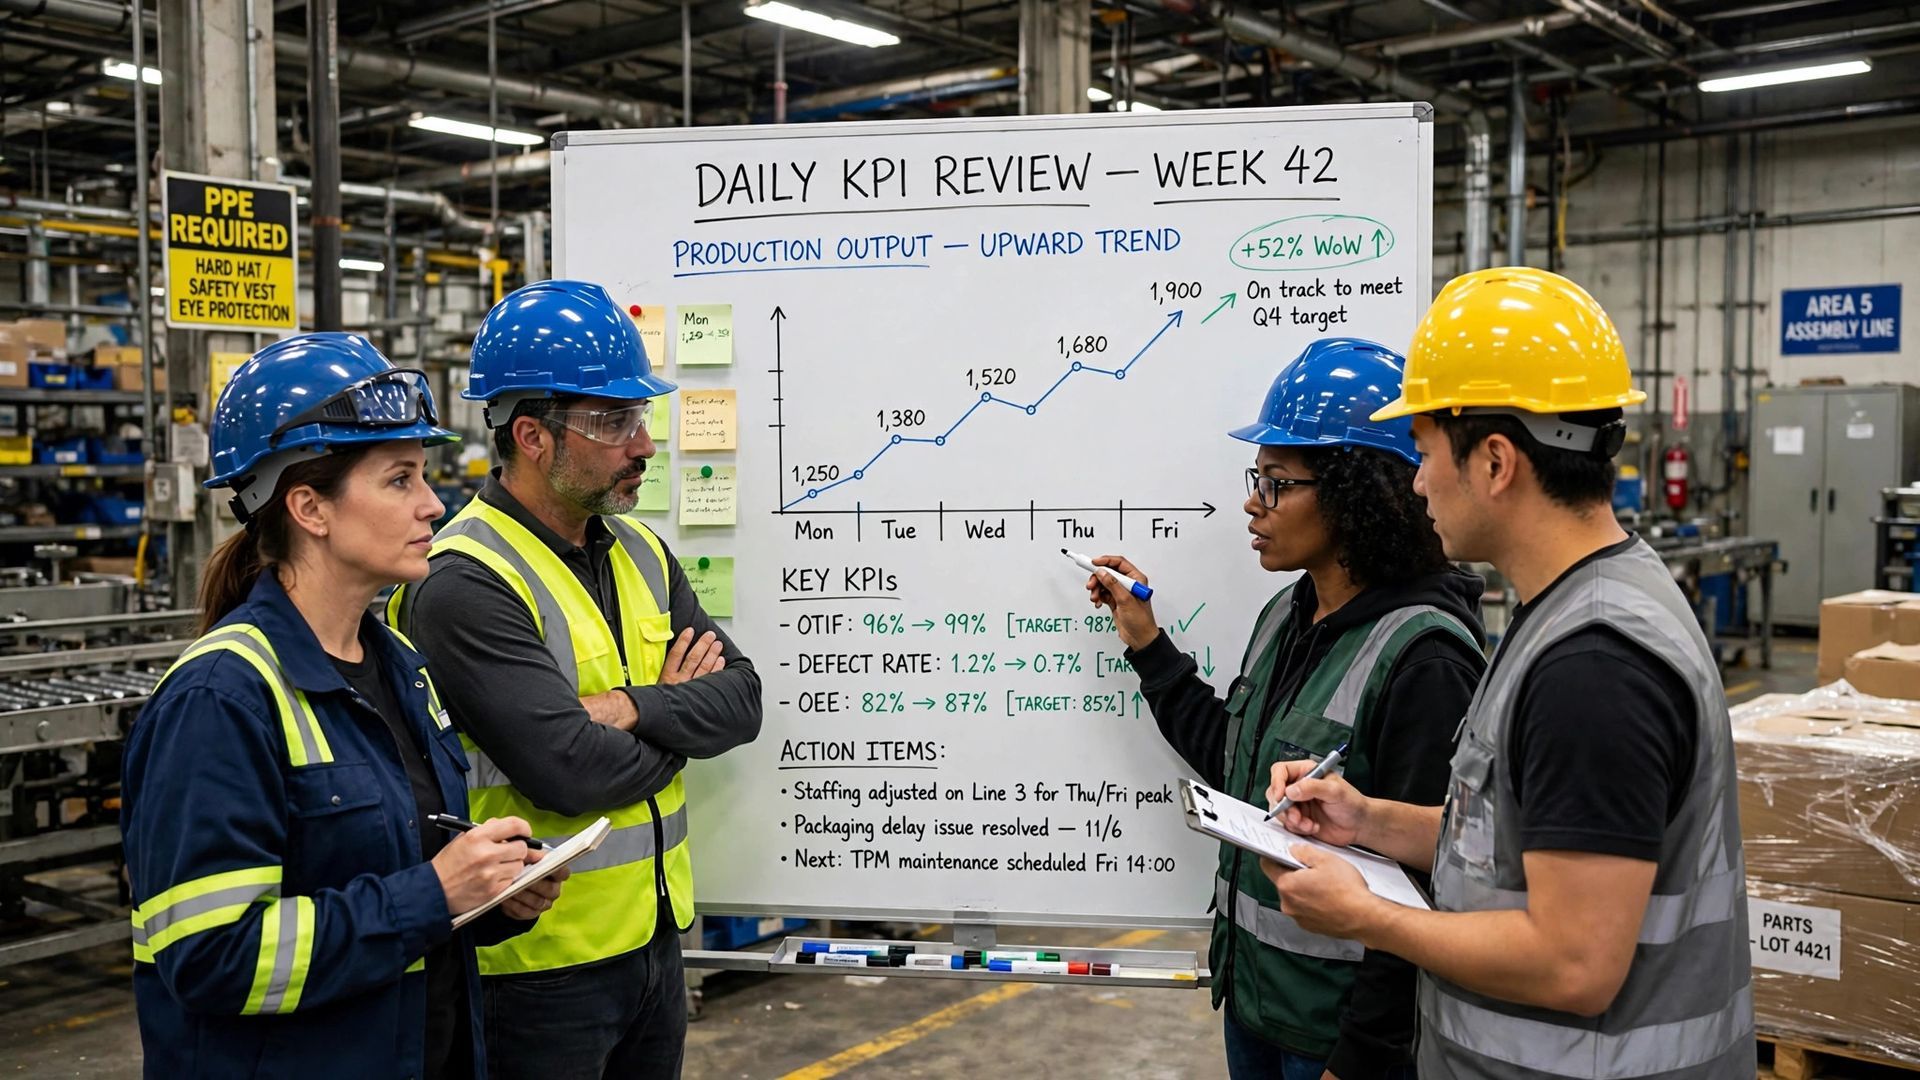
Benchmarks help you judge whether your score is weak, average, or strong. They are useful, but they should guide decisions rather than replace them. A plant at 60% may still make fast gains if it uses best practices and focuses on the largest losses first.
For many teams, the best use of industry benchmarks is to combine them with internal oee tracking. That way, you compare your current result with both outside reference points and your own trend line across manufacturing time.
OEE level
Practical meaning
100%
Perfect production: only good parts, at the fastest pace, with no stop time
85%
World-class target for many discrete manufacturers
60%
Fairly typical, with meaningful room to improve
40%
Common starting point for plants new to OEE; often improved with straightforward actions
If you are early in the journey, focus less on chasing a perfect number and more on building stable measurement and repeatable problem solving.
Conclusion
Calculating OEE is essential for manufacturing managers and engineers who aim to enhance productivity and maximize ROI. By understanding the components of availability, performance, and quality, you can identify areas for improvement in your operations. For instance, if your machine runs for 8 hours but experiences 2 hours of downtime, your availability would be 75%. Coupled with a performance efficiency of 85% and a quality rate of 90%, your OEE score would reflect the overall effectiveness of your machinery. Accurate OEE measurement leads to informed decision-making and ultimately better manufacturing processes. For more detailed insights on OEE and additional resources, visit our comprehensive OEE pillar page at https://www.empoweredautomation.com/oee. Remember, refining your OEE calculation will pave the way for manufacturing excellence!
Frequently Asked Questions
Is OEE Relevant for Small Manufacturers and Job Shops?
Yes. OEE is useful for small manufacturers as well as large plants because the math is based on planned time, output, and quality. Even one machine can benefit. A simple oee score helps smaller teams improve equipment effectiveness and manufacturing productivity without needing a large software stack.
How Does OEE Calculation Differ Across Production Lines?
The oee calculation stays the same across any production line: Availability × Performance × Quality. What changes is the data collection method, the ideal cycle time, and how counts or stops are captured. Some lines use manual logs, while others use automated systems for real time reporting.
What Are The Best Practices for Improving OEE?
Start with consistent measurement, then work the biggest losses first. Strong best practices include regular stop time review, clear operating rules, total productive maintenance, and simple training guides for operators. In any production process, steady continuous improvement beats occasional large projects that are not tied to actual loss data.
how to calculate oee
You might also like