Availability, Performance, and Quality: The Three OEE Factors Explained
Key Highlights
- Overall equipment effectiveness shows how well a manufacturing process uses production time.
- The oee calculation combines availability, performance, and quality into one oee score.
- Availability measures run time against planned production time and exposes downtime losses.
- Performance shows whether production speed is meeting ideal cycle time expectations.
- Quality tracks good parts versus total output and highlights first pass issues.
- When you improve all three factors together, manufacturing productivity and continuous improvement become easier to manage.
Introduction
If you manage a plant, line, or piece of equipment, you need a simple way to see where time and output are being lost. That is why the oee calculation matters. It gives you a practical view of your manufacturing process by breaking operational efficiency into three clear factors: availability, performance, and quality. Once you understand each one, you can spot waste faster, focus improvement efforts better, and make smarter decisions on the shop floor.
Understanding the Role of OEE in Modern Manufacturing
Overall equipment effectiveness is one of the clearest ways to measure equipment effectiveness in a modern manufacturing process. It shows how much of your planned production time turns into useful output instead of being lost to stops, slow running, or defects.
Availability, performance, and quality are the three parts of that picture. With stronger data collection and better oee data, managers and engineers can see where losses happen and respond with targeted action. The next sections break down what OEE means and why these factors matter.
Defining Overall Equipment Effectiveness (OEE)
Overall equipment effectiveness is a manufacturing metric used to measure how well a process or piece of equipment is actually performing. It helps you compare what should have happened during production time with what really happened on the shop floor.
The oee calculation is built on three factors. Availability measures whether the equipment was running when it was supposed to run. Performance measures whether it ran at the right production speed. Quality measures how many good parts were produced without defects or rework.
When you multiply those three values together, you get an oee score expressed as a percentage. A higher number means stronger overall efficiency. A lower result does not just say you have a problem. It points you toward the source, whether that is downtime, slow cycles, or quality loss.
Why Manufacturers Rely on OEE Metrics
Manufacturers rely on OEE because it turns daily production activity into something measurable and useful. Instead of guessing why output is low, you can track equipment effectiveness with one framework that shows where time, speed, and yield are slipping.
In practice, oee tracking supports better decisions because it gives valuable insights into losses that hurt manufacturing productivity. It helps you focus on what matters most:
- downtime that cuts available run time
- speed losses that reduce output
- defects that lower usable production
Just as important, OEE supports long-term improvement. It is used to identify bottlenecks, compare production lines, set targets, and monitor results over time. For managers and engineers, that makes it more than a metric. It becomes a practical tool for finding waste and improving overall performance.
Linking Availability, Performance, and Quality to OEE Success
OEE success depends on how well you manage all three factors together. A strong availability score means the equipment is ready and running. A strong performance score means it is producing near its maximum speed. A strong quality score means output meets standards the first time.
Here is the key point: one weak factor pulls the total down fast. You might have excellent run time, but if slow cycles reduce output, your total result still drops. The same is true when scrap or rework cuts into good count.
That is why oee improvements need balance. Focusing on only one area can create tradeoffs in another, such as pushing speed too hard and creating quality issues. Manufacturers get better results when they review availability, performance, and quality separately, then improve them in a coordinated way.
The Three Pillars of OEE Explained
Availability, performance, and quality are the three core oee components. Together, they form the gold standard for understanding where production losses come from. Each one answers a different question about how your equipment and process are performing.
Looking at oee data this way keeps the analysis practical. You can separate lost time, lost speed, and lost yield instead of treating low output as one vague problem. That makes it easier to decide what to fix first. Let’s look at each pillar on its own.
Overview of Availability in OEE
Availability shows how much of your planned production time became actual run time. If a line was scheduled to operate for a shift, availability asks a simple question: how much of that time was the equipment truly running?
Any stop time reduces this factor. That includes unplanned downtime from breakdowns, as well as losses from changeovers, adjustments, or scheduled maintenance if they are counted against the production window. The more time equipment sits still, the lower availability becomes.
For manufacturing managers, this factor is often the first place to look because lost time is highly visible and expensive. A machine that is not running cannot produce anything. That is why availability is closely tied to maintenance processes, response time, and how well the plant controls interruptions during production.
What Performance Means in OEE Calculations
Performance tells you whether equipment is producing at the rate it should. Even when a machine is running, it may still be underperforming if the actual production speed is below the expected rate.
This factor compares actual output with what should have been possible based on ideal cycle time. Small stops, idling, and slow cycles all create performance loss. These losses are easy to miss because the machine still appears to be operating.
That is why performance deserves its own review. A line can show good run time but still miss targets because it is not keeping pace. For engineers, performance analysis helps uncover hidden losses tied to settings, lubrication, operator practices, or other factors that reduce equipment performance without causing a full stop.
Understanding Quality as an OEE Factor
Quality measures how much of your total output is usable. In OEE terms, it looks at how many good parts are produced compared with the total number of units made during production.
Any scrap, reject, or rework reduces this factor. That means quality loss includes more than obvious defects. If a unit does not meet quality standards the first pass and needs extra work, it still damages the score because it consumed time and material without delivering clean output.
For plants focused on product quality, this is where OEE connects directly to customer expectations and internal waste. Good quality means producing the right parts, the first time, with less rework and less scrap. It is a direct measure of how well your process turns run time into sellable output.
Availability: Reducing Downtime in Manufacturing
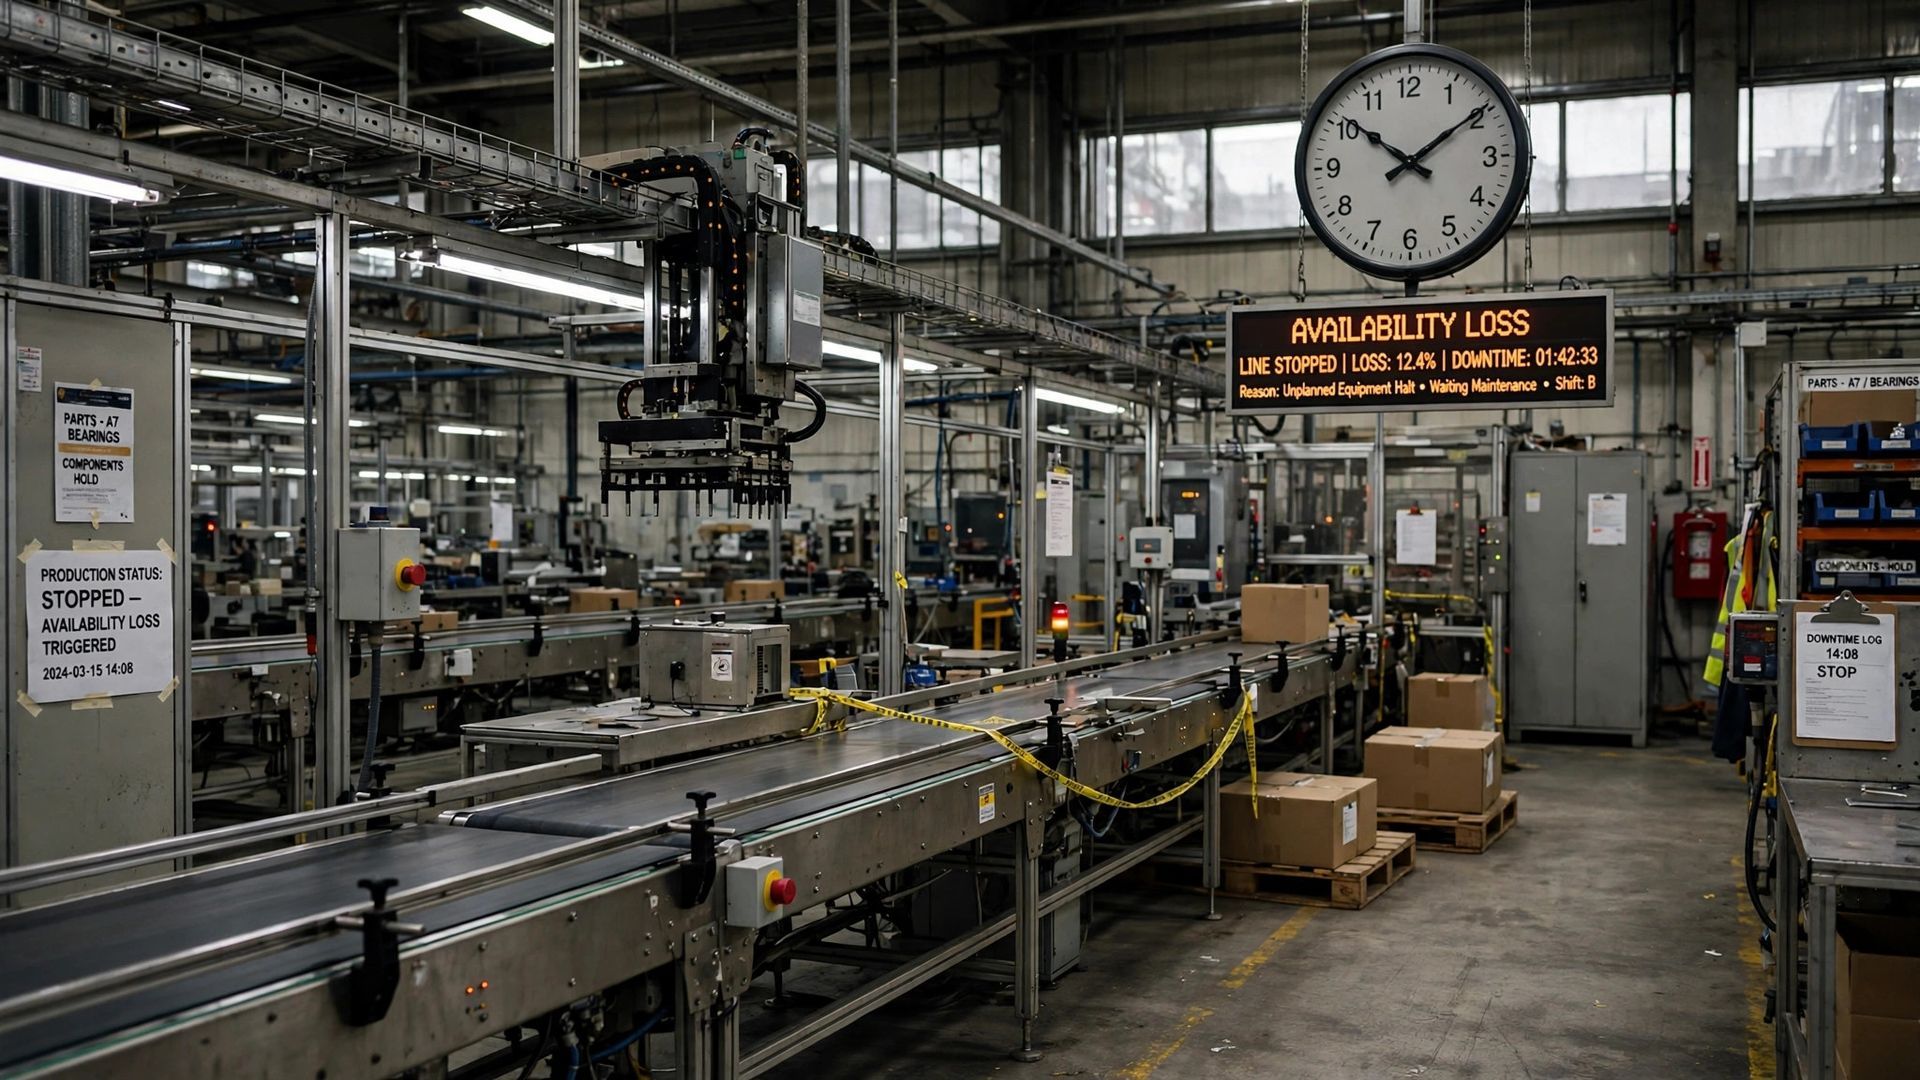
Availability is all about protecting productive time. When unplanned downtime increases, run time falls, and your OEE drops before you even think about speed or defects. Equipment failures, long adjustments, and poorly controlled stops all take away from planned production time.
For most plants, that makes availability a practical starting point. If the machine is not running, nothing else matters. The next sections explain what availability means, the formula behind it, and a simple plant example.
What Is Availability in OEE?
Availability in OEE measures the share of planned production time that becomes actual run time. It answers a basic but important question: during the time you expected to produce, how much time was the equipment truly operating?
The gap between those two numbers comes from stop time. That can include unplanned downtime from breakdowns, power issues, material shortages, or emergency maintenance. It can also include setup and changeover losses, depending on how your plant defines the production window.
For managers and engineers, availability is a direct indicator of uptime discipline. It reflects how well the plant handles interruptions and how quickly the team restores operation after a stop. If planned production time is high but run time is low, availability will show the loss clearly and early.
The Formula for Calculating Availability
The availability formula is straightforward. In any OEE calculation, availability score = run time ÷ planned production time. The result is usually shown as a percentage.
Here is how to think about it. Planned production time is the time set aside for manufacturing. Run time is what remains after losses from stops are removed. If you schedule 480 minutes and lose 60 minutes to downtime, your run time is 420 minutes.
So the math would be 420 ÷ 480 = 0.875, or 87.5%. That means the equipment was available for production during 87.5% of the planned window. This formula makes availability easy to track shift by shift, line by line, or machine by machine, which is why it is such a useful starting point in OEE work.
Practical Example: Solving for Availability in a Real Plant Setting
Imagine a packaging line scheduled for 8 hours, or 480 minutes. During the shift, the line has 25 minutes of unplanned downtime from a fault and 35 minutes of additional stop time from waiting and adjustment. That totals 60 minutes lost.
Now subtract the lost time from the schedule. Run time = 480 - 60 = 420 minutes. Availability = 420 ÷ 480 = 87.5%. That percentage becomes the availability input for your oee score.
This example is useful because it separates lost production from active manufacturing time. Even short interruptions and idle time matter when they add up over a shift. If you monitor these losses consistently, you can see whether the biggest hit is coming from equipment issues, response delays, or recurring stops that should be eliminated.
Performance: Maximizing Production Speed
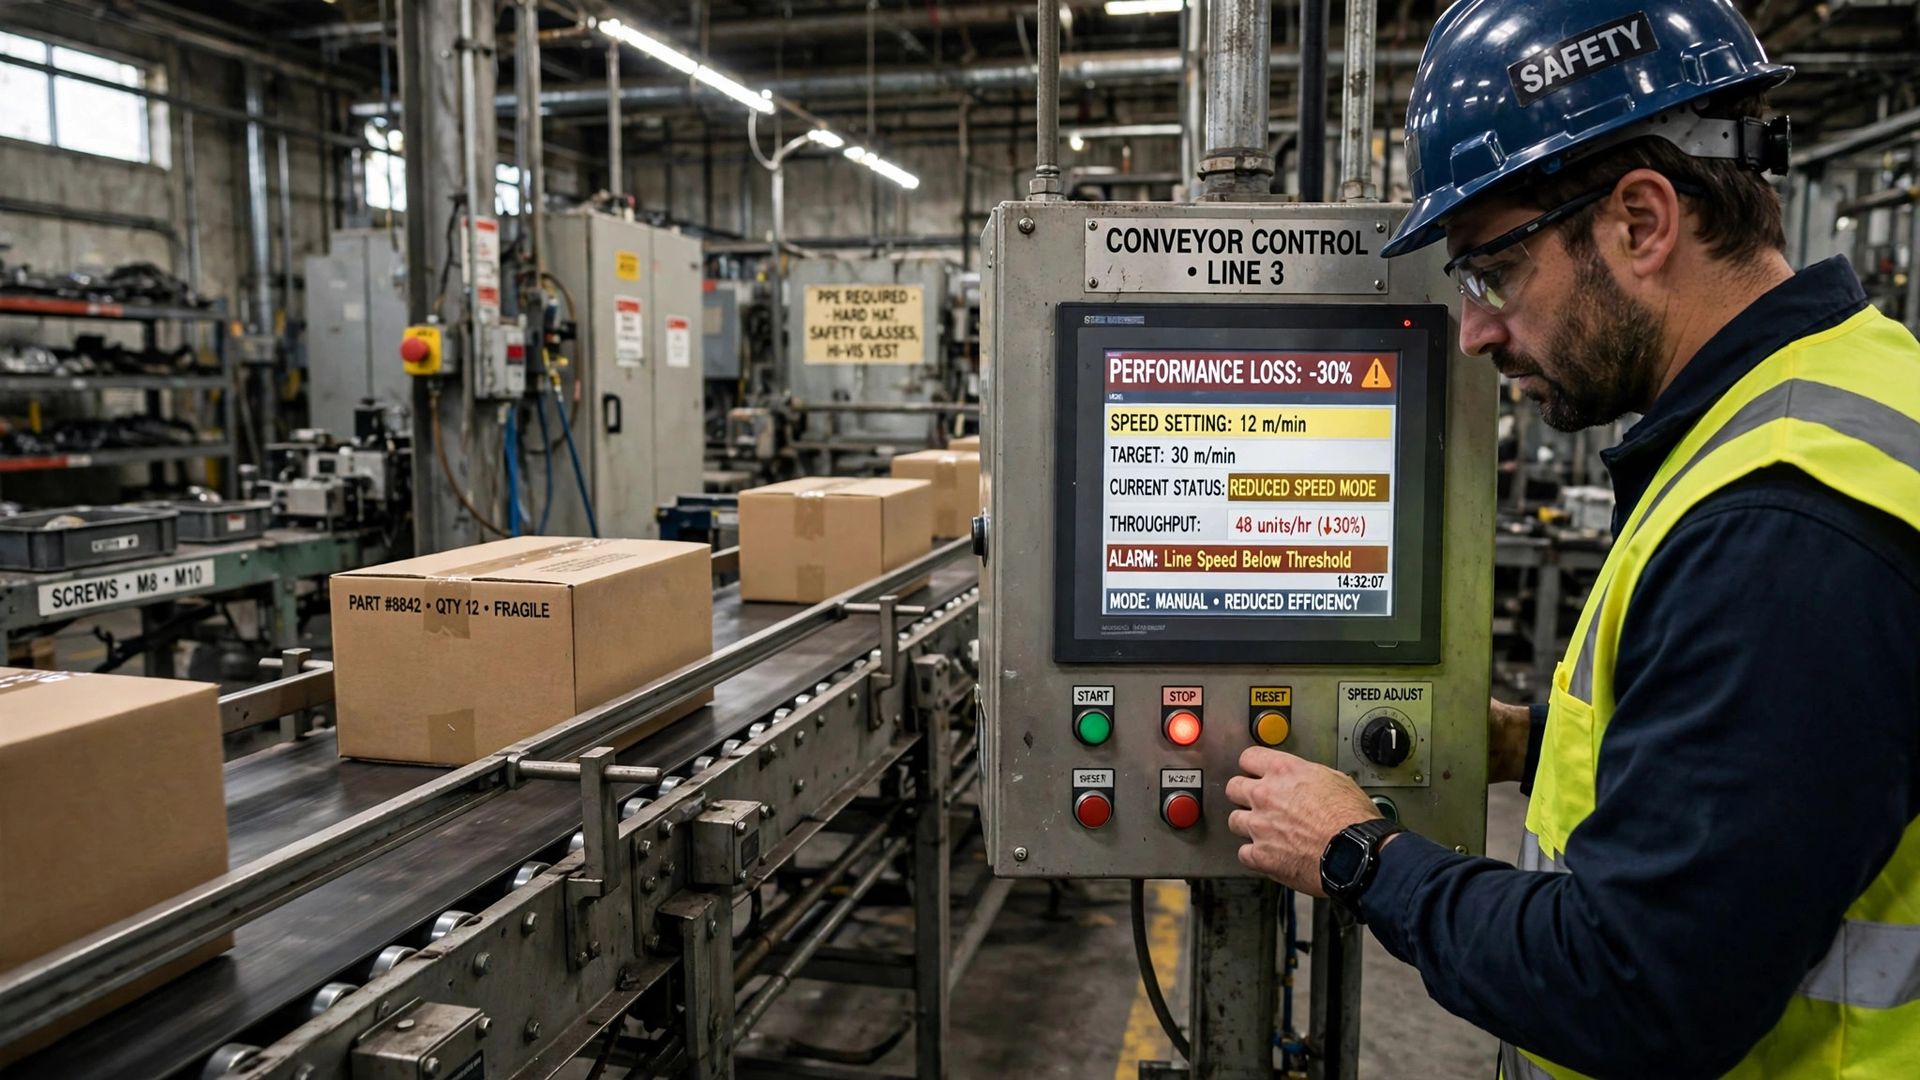
Once equipment is running, the next question is speed. Performance measures whether your actual output matches the rate your process should achieve based on cycle time. When production speed slips, performance score falls, even if uptime looks strong.
This is why equipment performance needs separate attention. Small stops, idling, and slower running create hidden performance loss that can drain capacity. The following sections explain the meaning, formula, and a worked example for performance.
What Does Performance Mean for Machinery Output?
Performance measures how efficiently a machine runs while it is operating. In simple terms, it compares actual output with the output that should have been reached if the equipment had run at its expected rate.
That expected rate comes from cycle time or ideal cycle time. If the machine can produce at a defined maximum speed but spends the shift running slower, stopping briefly, or idling between units, the performance score drops. These are not availability losses because the machine may still be on. They are speed losses.
For machinery output, this matters because hidden speed loss can reduce production capacity without triggering alarms. A line may appear busy all day and still miss targets. Reviewing performance helps you find those quiet losses and understand why actual production output is below potential.
How to Calculate Performance in OEE (With Formula)
The standard performance formula in an OEE calculation is: Performance score = (Ideal cycle time × total count) ÷ run time. This shows how much of the available running time was used at the expected rate.
Ideal cycle time is the fastest expected time to produce one unit. Total count is the number of units produced, and run time is the actual operating time after stop losses are removed. If production output is lower than what run time should allow, the score falls.
Here is a simple setup. Suppose ideal cycle time is 1 minute per unit, total output is 350 units, and run time is 420 minutes. Performance = (1 × 350) ÷ 420 = 0.833, or 83.3%. That tells you the line ran below its expected speed during available time.
Worked Example: Calculating Performance Losses
Let’s use a filling line with 420 minutes of run time. The ideal cycle time is 1 minute per unit, but the line only produces 350 units during that window. The performance result is 350 ÷ 420 = 83.3%, so the line is losing speed during operation.
This kind of performance loss often comes from issues that do not fully stop the machine. Common causes include:
- slow cycles caused by cautious operation or worn settings
- brief interruptions that reduce output but are not tracked as downtime
- idling that lowers equipment performance during the shift
For your oee score, this matters just as much as downtime. A line that is available but not running near its target rate will leave capacity unused. That is why performance review should focus on actual speed behavior, not just whether the machine was technically on.
Quality: Ensuring Defect-Free Production
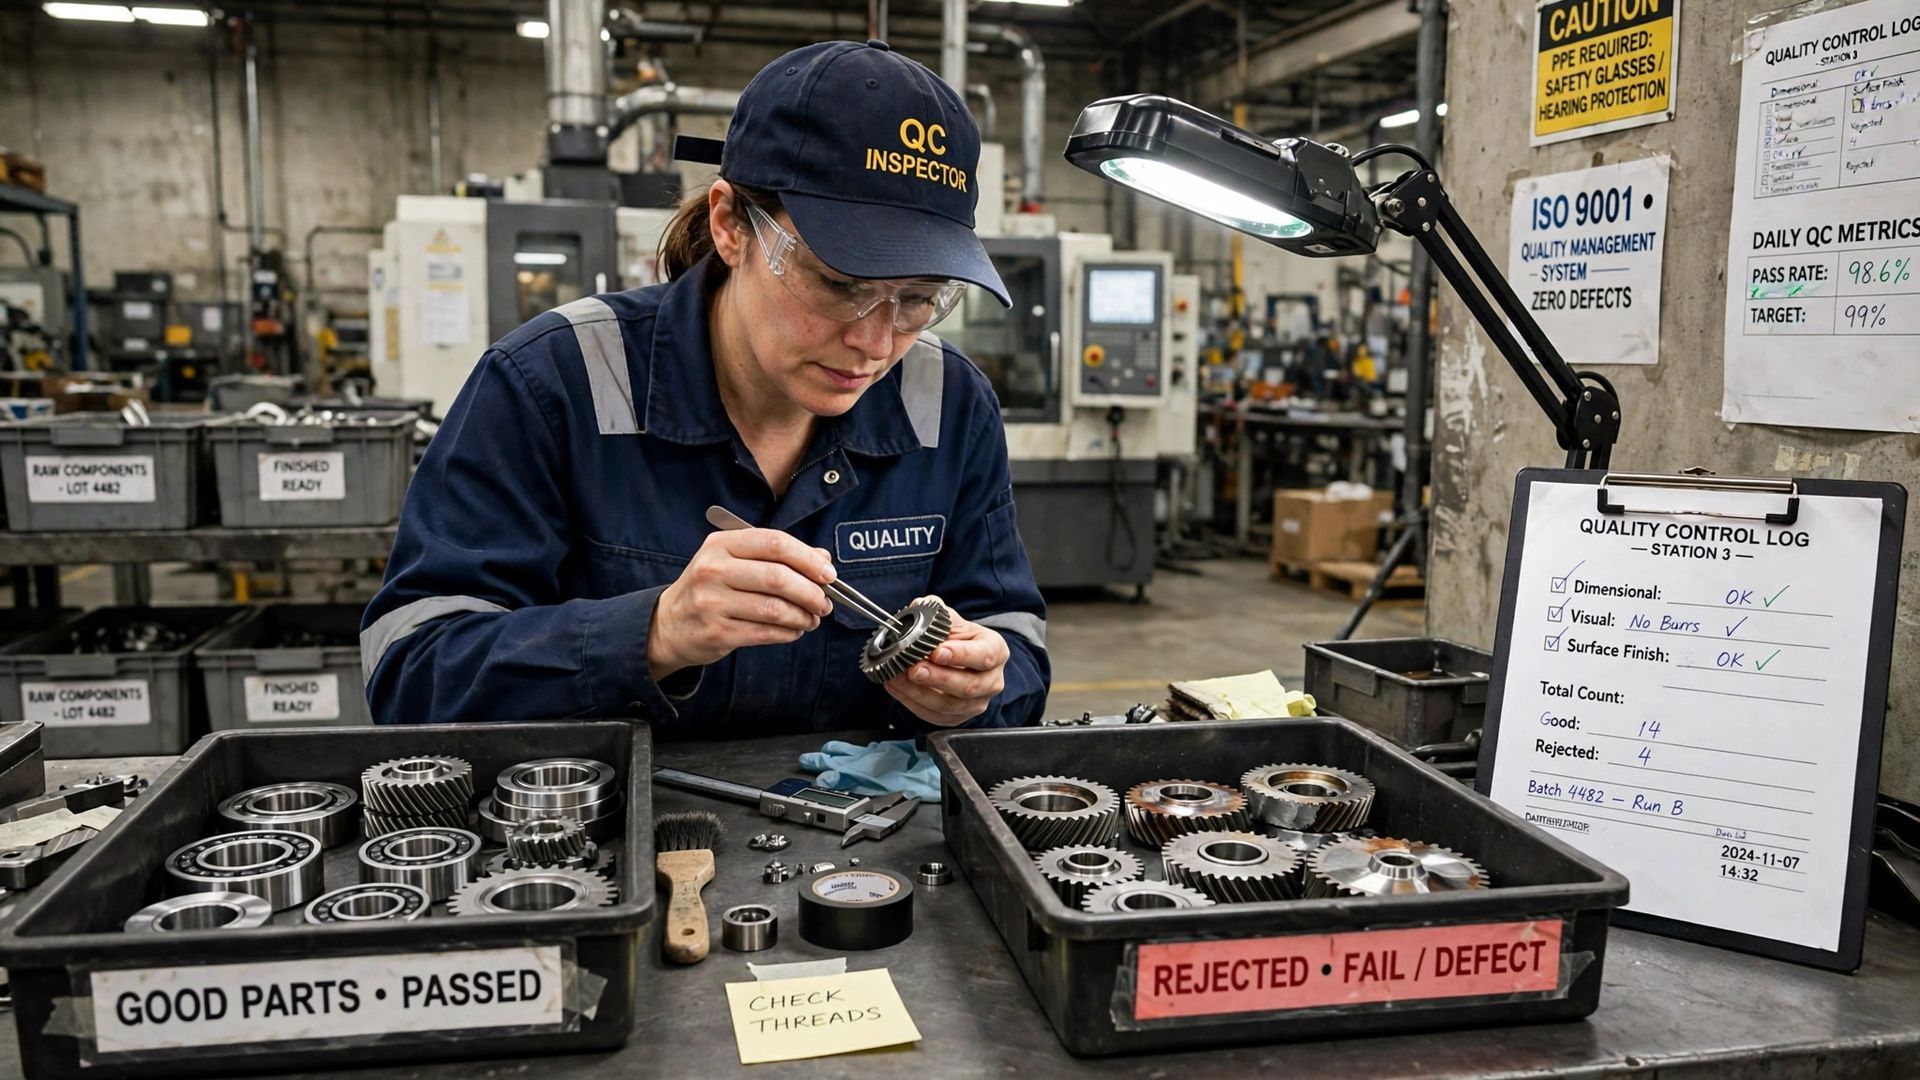
Quality is the third OEE factor, and it answers a simple question: how much of what you produced is actually usable? If defects, scrap, or rework rise, product quality drops and your OEE falls with it. Good parts and good units are what count.
For plants under pressure to meet quality standards, this factor connects output to customer expectations and internal waste. The next sections define quality in OEE, show the formula, and walk through a step-by-step example.
Defining Quality for OEE Purposes
In OEE, quality measures the share of production that meets requirements without rework. It focuses on good units produced first time, not just total units that eventually leave the line.
This matters because product quality is about more than final output volume. If parts fail to meet quality standards and require extra labor, extra machine time, or scrap handling, the process has still lost efficiency. OEE captures that loss directly.
For practical use, think of quality as first-pass yield inside the broader OEE model. If a line produces 1,000 units but only 970 are acceptable first time, the remaining 30 units reduce the quality result. That gives managers a clean way to connect defects, rework, and waste to equipment effectiveness.
The Quality Calculation Formula Explained
The quality formula is simple: Quality score = good count ÷ total count. In an oee calculation, this gives the percentage of units that meet quality standards without requiring rework or being scrapped.
Good count means acceptable output. Total count includes everything produced, whether it passed or failed. If you make 500 units and 485 are good, the quality score is 485 ÷ 500 = 0.97, or 97%.
This formula is important because it keeps the focus on usable production, not just volume. A plant can show strong output and still lose efficiency if defects are high. Tracking quality this way helps you see whether quality issues are isolated events or part of a repeat pattern that needs process correction.
Step-by-Step Example: Measuring Quality Rate in Production
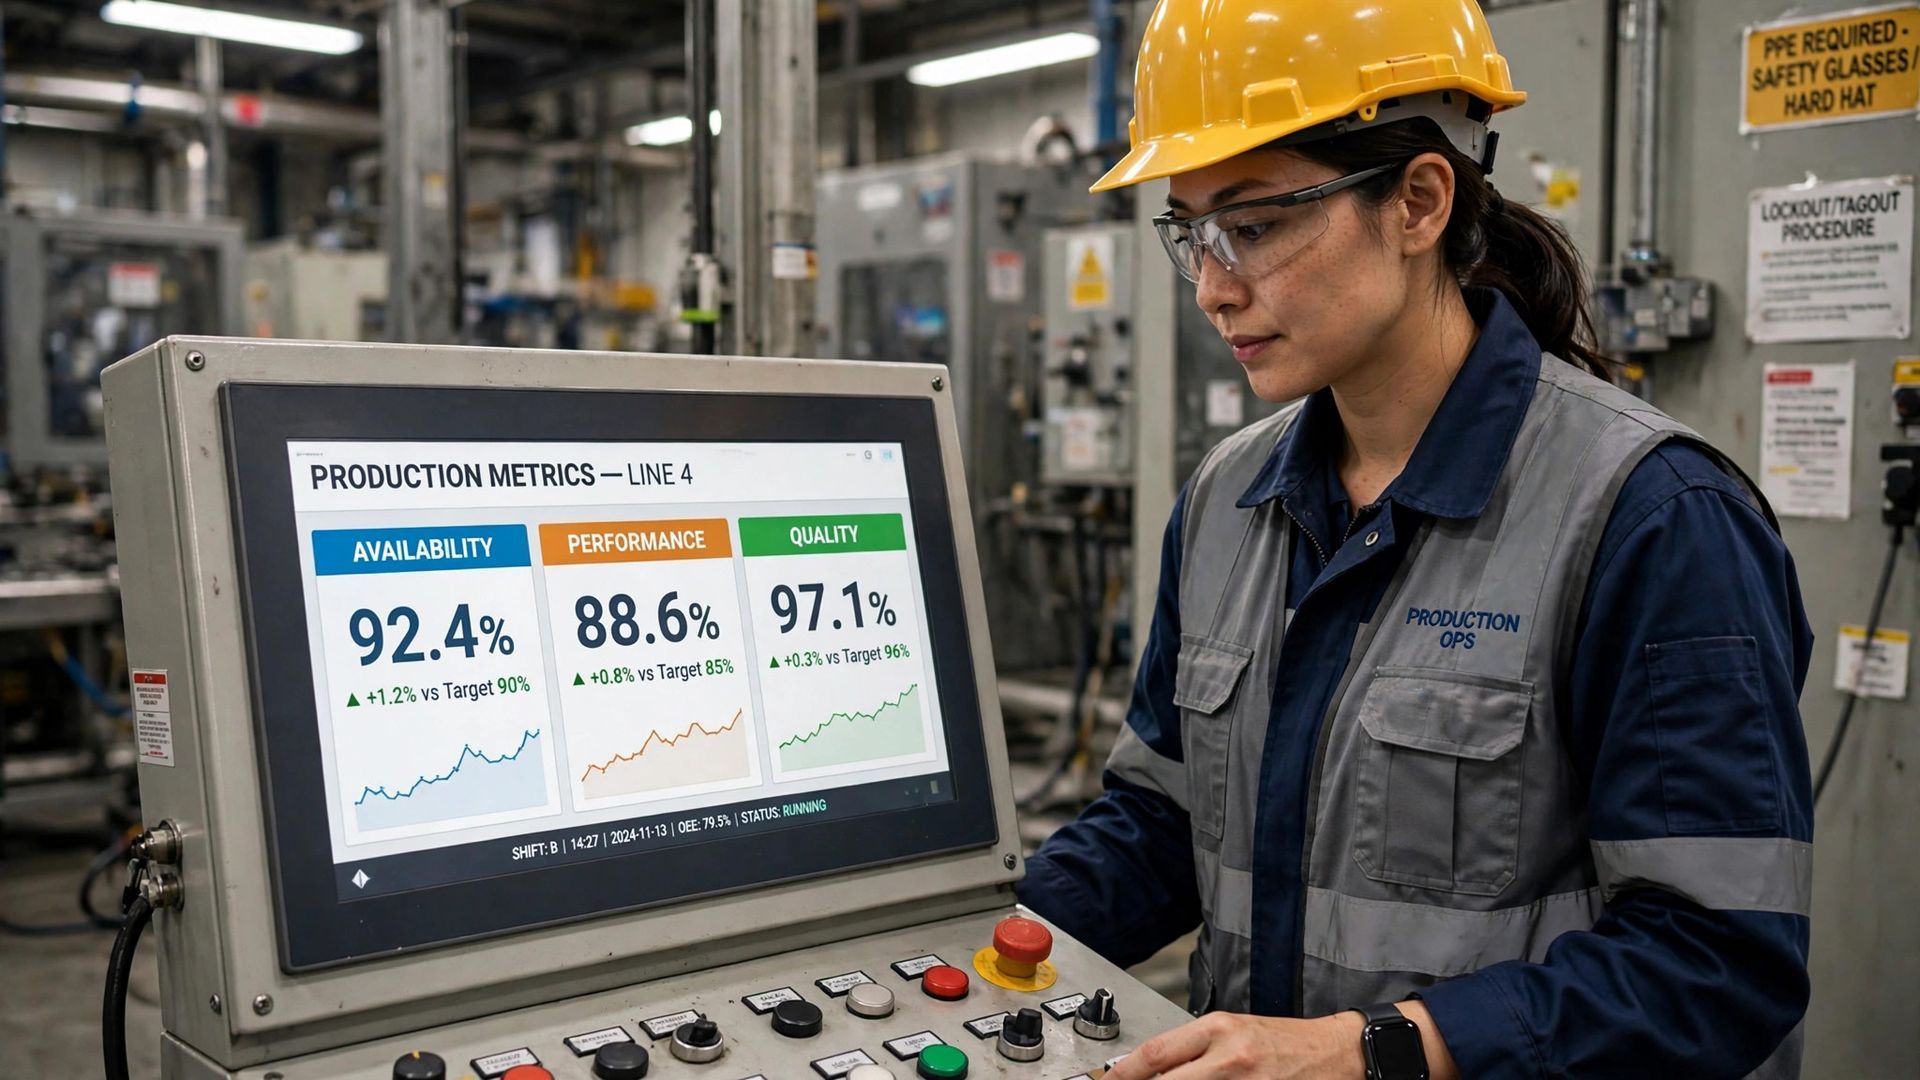
Suppose a line produces 350 total units during a shift. After inspection, 340 are accepted and 10 are rejected or sent to rework. Those 340 are your good units. The rest create quality loss because they did not meet quality standards first pass.
Use the formula: Quality = good units ÷ total units. So the math is 340 ÷ 350 = 0.971, or 97.1%. That value becomes the quality input in your oee score.
Measure
Value
Total units produced
350
Good units
340
Rejected or reworked units
10
Quality formula
340 ÷ 350
Quality result
97.1%
A simple table like this helps teams review daily yield quickly and spot whether quality is becoming the main source of lost effectiveness.
Bringing It All Together: Calculating OEE Using the Three Factors
Once you have each factor, the full oee calculation is straightforward. You multiply availability score, performance score, and quality score to get one overall oee score. That final percentage shows how much of your planned production time turned into good output at the right speed.
This matters because OEE does not hide the source of loss. It combines the three factors, but it also lets you see each one separately. For a fuller overview, you can also review the OEE pillar page at https://www.empoweredautomation.com/oee.
The Combined OEE Formula
The combined OEE formula is: OEE = Availability score × Performance score × Quality score. Each factor must be calculated first on its own, then multiplied together to get the final percentage.
This structure is what makes OEE useful. Instead of one vague measure of output, you get three clear views of loss. Availability shows time loss, performance score shows speed loss, and quality score shows yield loss. Together, they reflect the true effectiveness of a process or piece of equipment.
For manufacturing teams, this also improves problem solving. If the total OEE is low, you do not have to guess why. You can check the three inputs, identify the weakest factor, and focus your efforts there. That makes the oee calculation both simple and actionable.
Sample Calculation: Availability × Performance × Quality
Using the examples above, let’s combine the values. Availability score is 87.5%, performance score is 83.3%, and quality score is 97.1%. Convert them to decimals before multiplying: 0.875 × 0.833 × 0.971.
The result is about 0.708, or 70.8%. That is your oee score. It means that about 70.8% of planned production time was converted into good output at the expected rate.
Factor
Value
Availability score
87.5%
Performance score
83.3%
Quality score
97.1%
OEE formula
0.875 × 0.833 × 0.971
OEE score
70.8%
This kind of text table gives operators, engineers, and managers one quick view of the full calculation and the source of the total result.

Interpreting Your OEE Score and Identifying Weakest Links
A single oee score is useful, but the real value comes from reading the three factors behind it. If OEE is low, the next step is to compare availability, performance, and quality side by side and find the smallest number.
That lowest factor usually points to the weakest links in the process. For example:
- low availability suggests downtime and stop-related losses
- low performance points to slow running, idling, or small stops
- low quality highlights scrap, rejects, or rework
These comparisons give valuable insights for improvement efforts. You do not need to fix everything at once. Start where the biggest loss is happening, then track whether the change improves the total result. If you want a broader framework for that work, the pillar page at https://www.empoweredautomation.com/oee is a helpful next stop.
Conclusion
In conclusion, understanding and effectively managing the three OEE factors—availability, performance, and quality—are essential for enhancing your manufacturing processes. Each factor plays a vital role in determining overall equipment effectiveness, helping you identify areas for improvement and drive productivity. By calculating these metrics accurately, you can uncover opportunities to minimize downtime, maximize speed, and ensure defect-free production. As you focus on these areas, you’ll not only improve your OEE scores but also contribute to a more efficient and profitable operation. For a deeper dive into optimizing your OEE strategy, visit our OEE pillar page here.
Frequently Asked Questions
How do downtime and speed losses impact OEE scores?
Downtime reduces availability because unplanned stops cut run time from planned production time. Speed losses reduce performance because slow cycles and minor interruptions lower output during run time. Both push the oee score down, even before quality is considered, so tracking each loss separately is important.
What are good benchmarks for availability, performance, and quality?
The compiled information notes that many manufacturers reference world-class OEE and the gold standard idea, but it also warns against chasing a fixed benchmark without context. In practice, use oee tracking to set a baseline, compare trends, and improve your availability score, performance score, and quality score over time.
What are common mistakes when measuring the three OEE factors?
Common mistakes include manual data entry errors, weak data collection, and incomplete tracking of quality issues, stops, or speed loss. Another problem is focusing only on big losses while missing frequent small ones. These gaps make oee improvements harder because the root causes are not being measured clearly.
You might also like