Manual OEE Tracking: Spreadsheets, Whiteboards, and Where They Break
Key Highlights
- Manual OEE tracking uses spreadsheets, whiteboards, and paper forms to organize oee data from the manufacturing process.
- You only need a few core numbers to start oee tracking, but consistent data collection is critical.
- Manual oee works best in a pilot area, such as one machine, cell, or line.
- In practice, small stops, shift handoffs, and missed entries weaken manual oee accuracy.
- Warning signs show up when your team spends more time compiling data than improving performance.
- When that happens, review the OEE pillar page for next steps: https://www.empoweredautomation.com/oee
Introduction
Overall equipment effectiveness gives you a practical way to see how well a machine or line performs during scheduled production. For many plants, oee tracking starts with manual oee methods like spreadsheets, whiteboards, and shift logs because they are familiar and low cost. That approach can teach your team the basics fast. Still, every manufacturing process reaches a point where handwritten notes and manual updates stop helping. To improve results, you need to know where manual tracking fits and where it starts to fail.
Understanding Manual OEE Tracking in Manufacturing
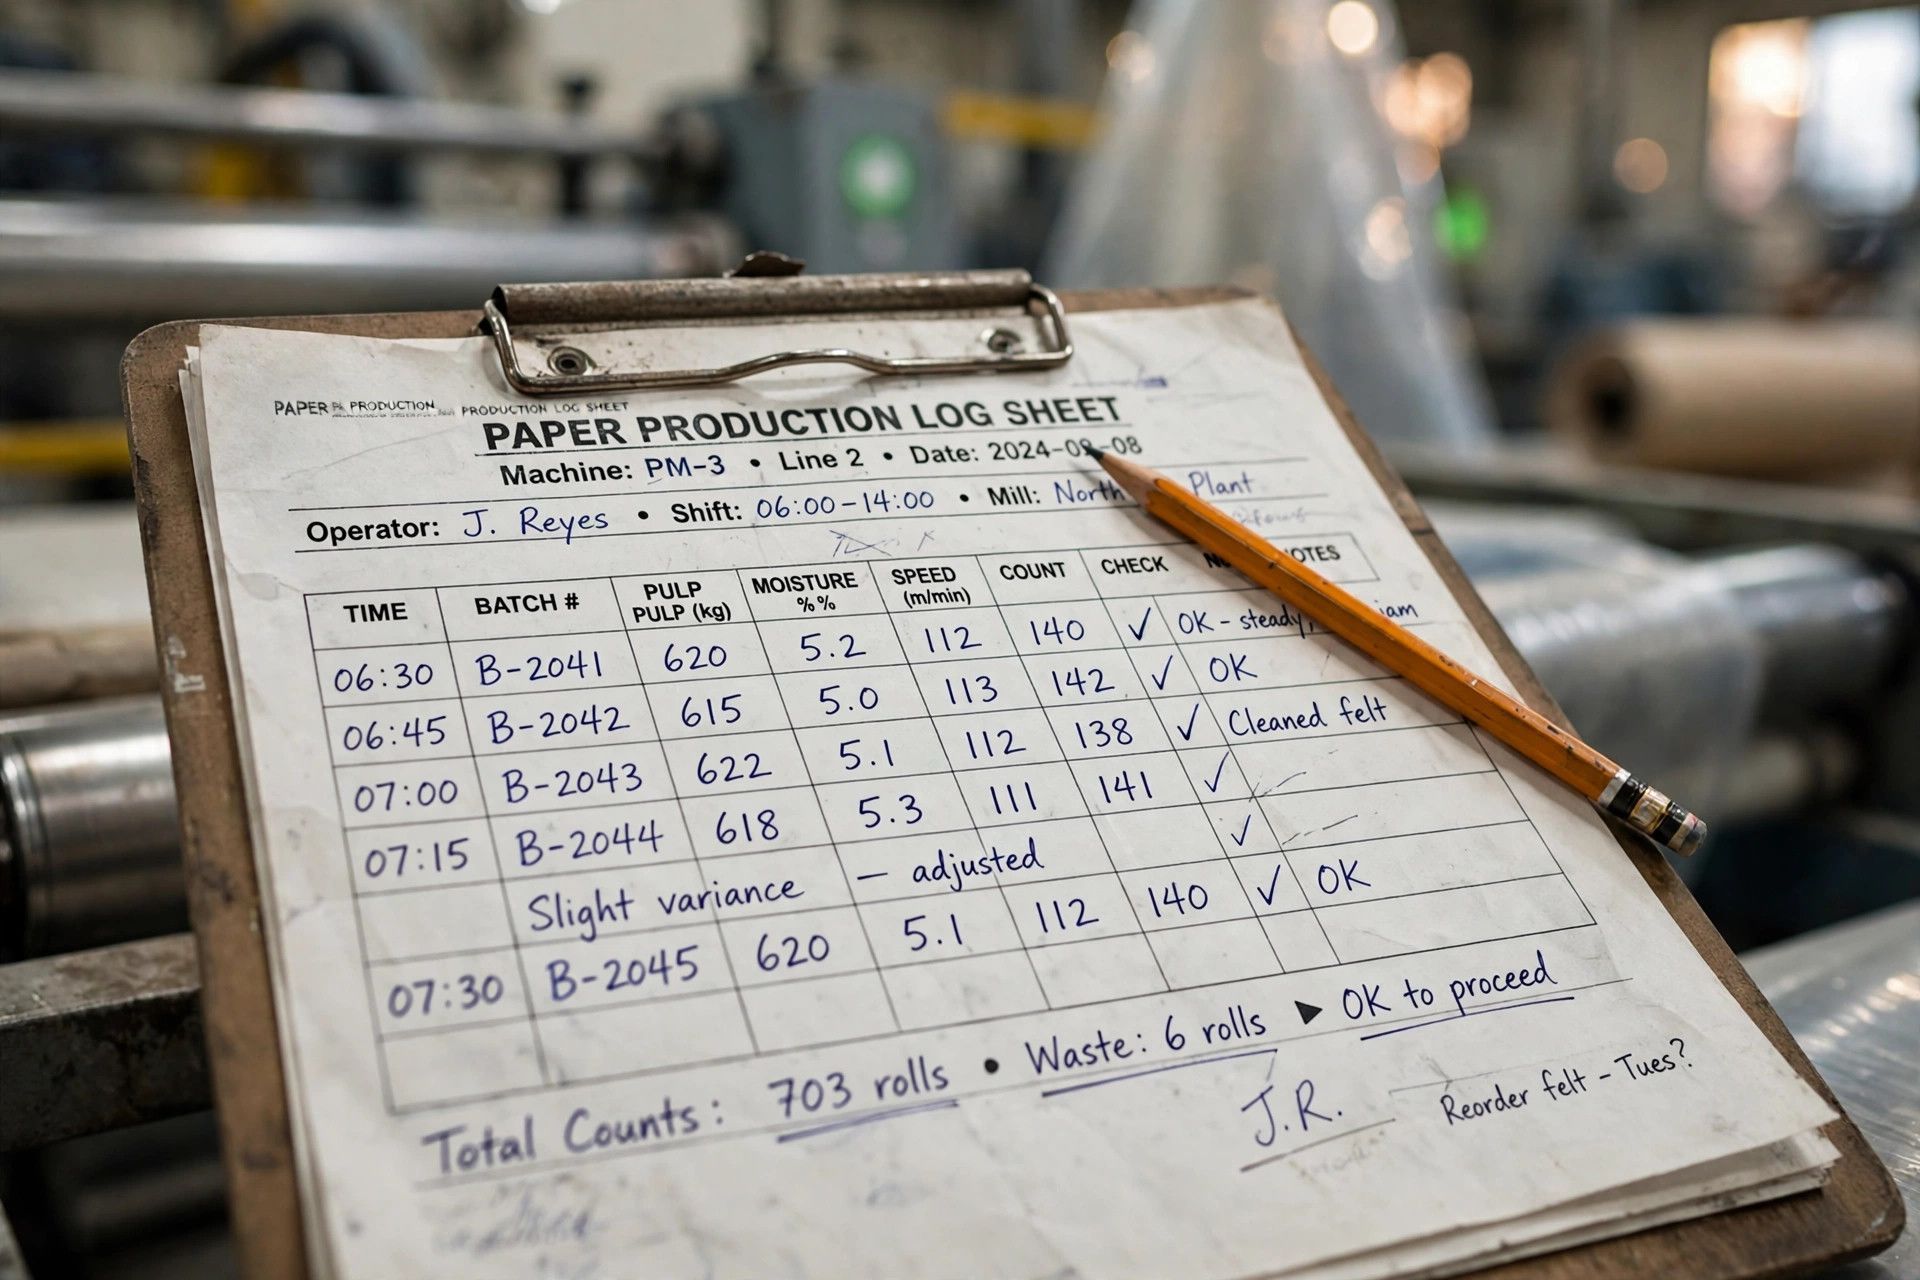
At its core, manual tracking means operators and supervisors record oee data by hand on the shop floor. They log stop time, counts, and basic loss data, then use that information to calculate the three oee factors. If you want to track OEE accurately without specialized software, this is the starting point.
The challenge is not the math. It is the discipline needed in a busy manufacturing process. People forget entries, round times, or miss short interruptions. Those gaps make the number look usable while hiding what the equipment actually did. That is why understanding OEE itself comes first.
Overall equipment effectiveness measures how much of your planned production time turns into productive time. It combines three factors: Availability, Performance, and Quality. Your oee score is not just a report number. It shows whether equipment is running when scheduled, producing at the expected pace, and making good parts the first time.
For a basic oee calculation, you need clear definitions and consistent records. Good Count, Ideal Cycle Time, and Planned Production Time are the foundation. To understand losses, you also need Run Time, Stop Time, and either Total Count or Reject Count. Without those inputs, you cannot trust the result.
Why does that matter to you? Because effective equipment performance improves only when the score points to real losses. A clean number by itself does not fix anything. Detailed loss data tells you where time, speed, and quality are slipping away.
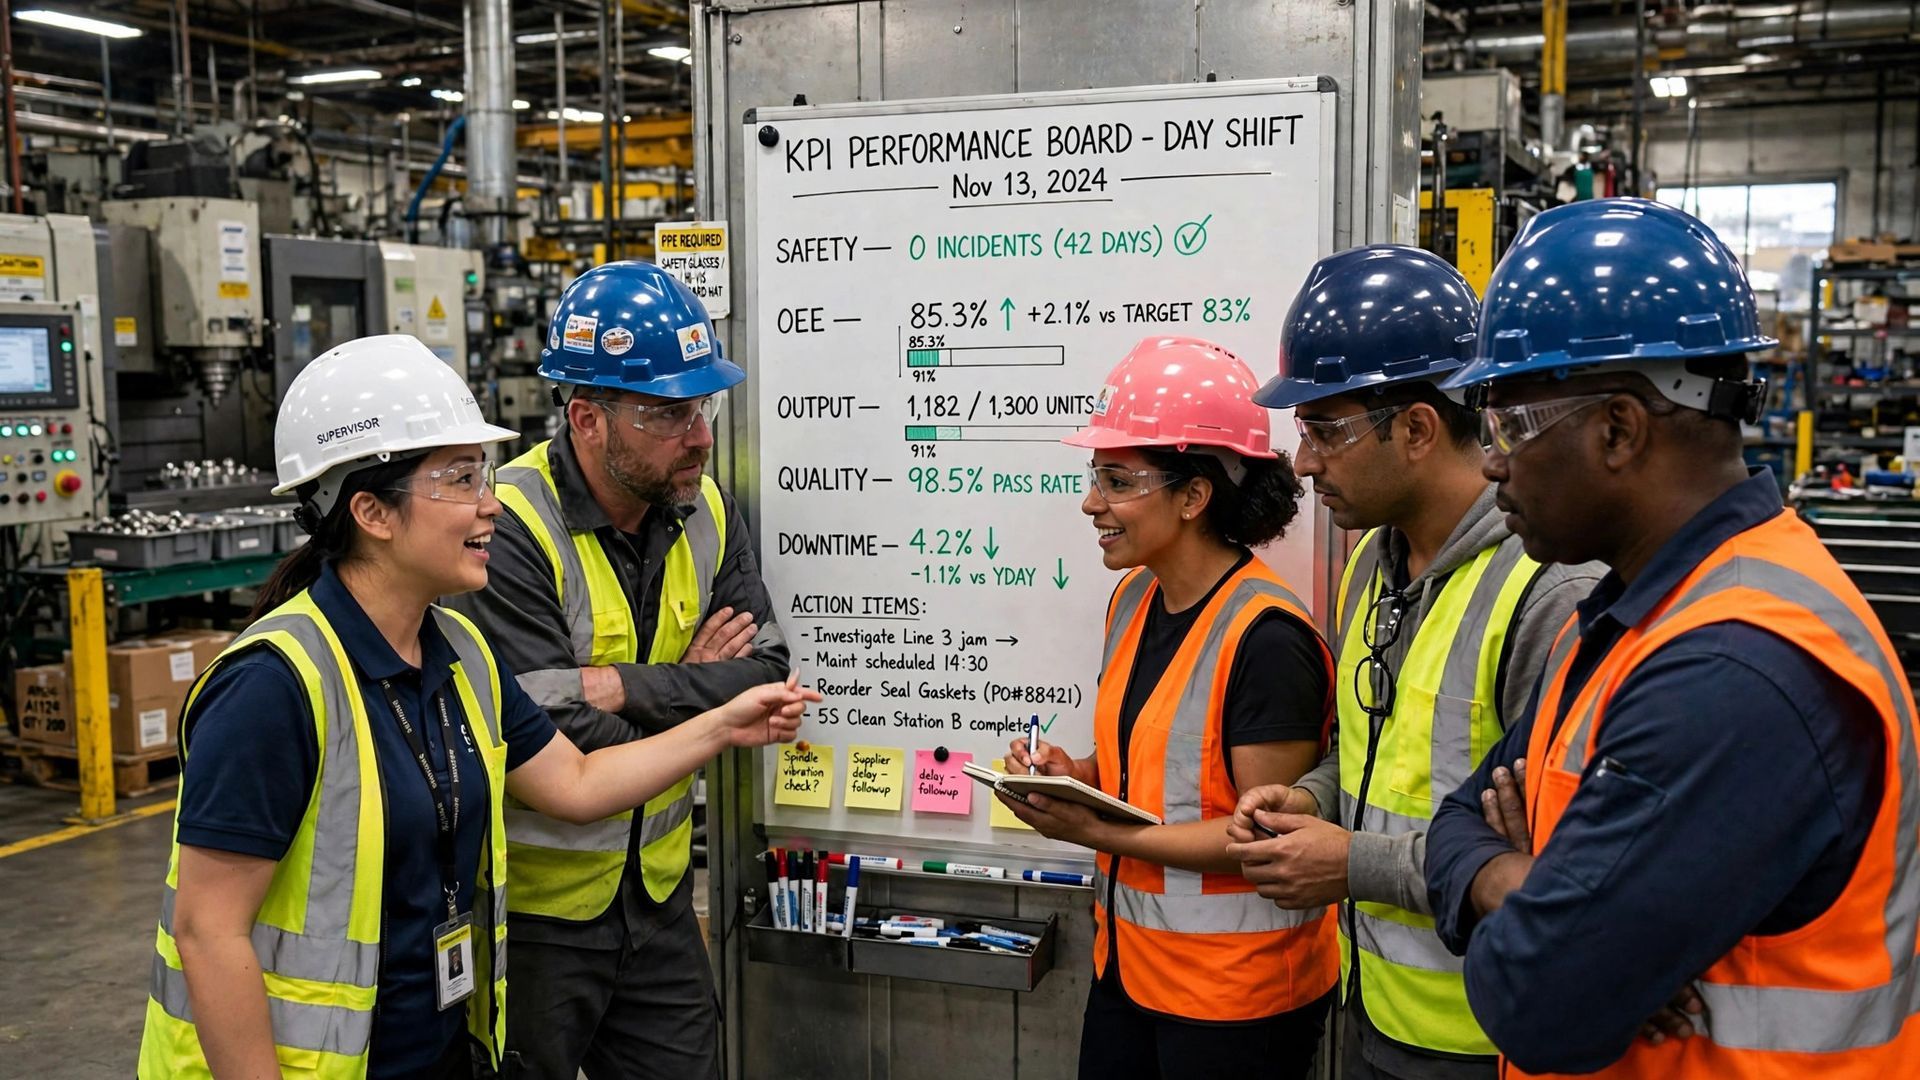
In many plants, manual oee begins with spreadsheets and whiteboards because they are simple, cheap, and easy to explain. A whiteboard on the line can show shift goals, downtime events, and counts. A spreadsheet can total the entries and handle the formulas for Availability, Performance, and Quality.
That setup works well for early data collection. It helps operators see what needs to be recorded and gives supervisors one place to review the day. Teams often use a project organizer, a stop reason tick sheet, or a stop event log to support manual tracking with more structure.
Still, these tools depend on timely entry and clear handwriting or typing. If data moves from paper to a spreadsheet hours later, errors slip in. Whiteboards support visibility, but they do not create a time-stamped record on their own. That is where manual systems begin to strain.
Manual oee still makes sense when you are starting small and want your team to learn the method. A pilot area is usually the best place to begin. That could be one machine, one cell, or one line where employees are engaged and the manufacturing process is stable enough to measure.
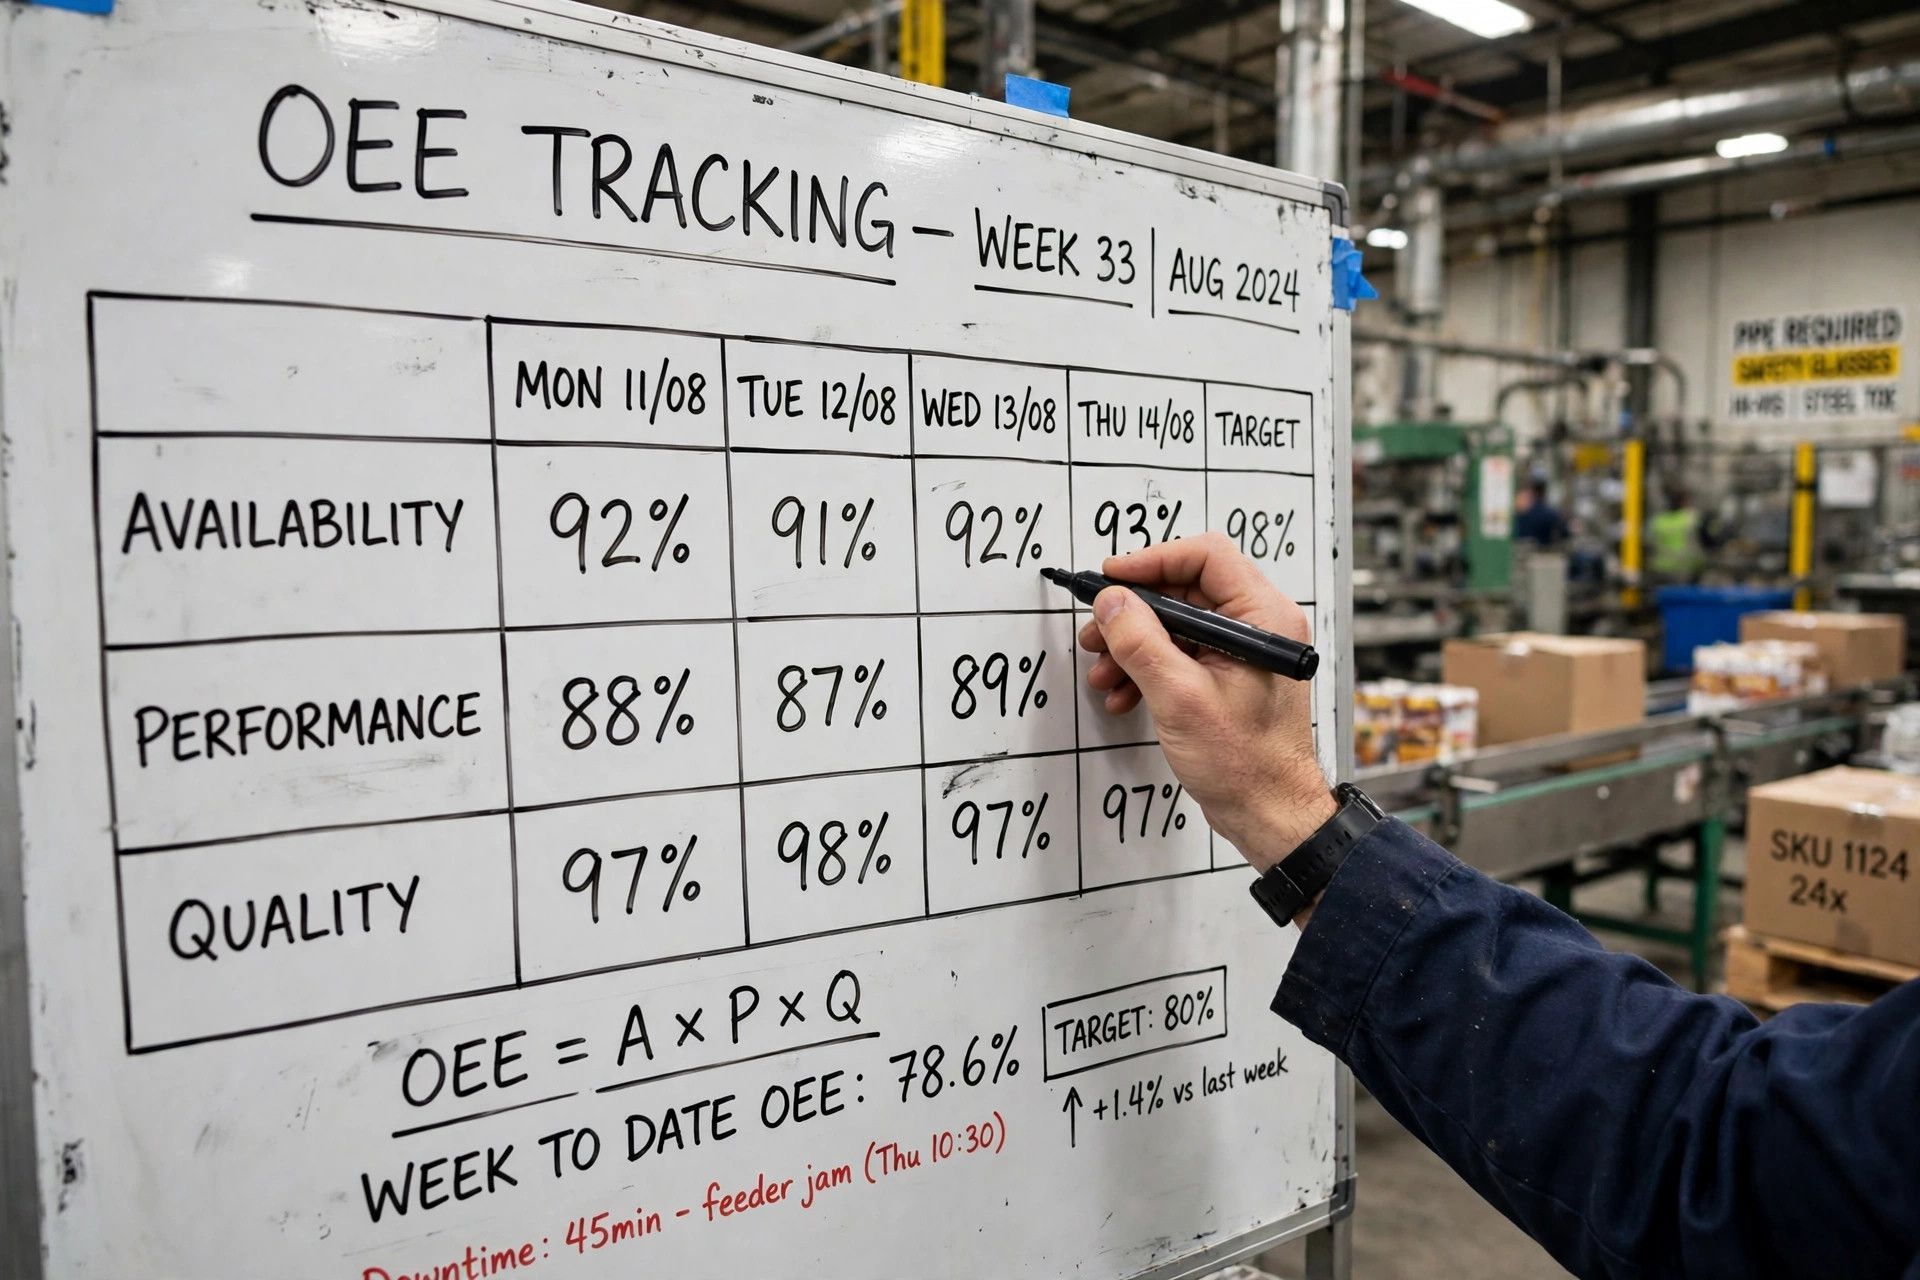
On the shop floor, manual data collection is most useful when the goal is awareness first, precision second. It teaches people how losses affect output and why definitions matter. Manual logs also work better when one part or several parts share the same cycle time.
It is a reasonable fit when:
- You are launching OEE for the first time in one pilot area.
- Your team needs to learn the logic behind the numbers.
- The process is simple and easy to observe.
- Production volume is manageable with manual logs.
- You want a low-cost starting point before broader change.
Core Metrics for Manual OEE Tracking
To build a useful oee calculation, you need more than a final oee score. Manual oee depends on a small set of core inputs recorded the same way every shift. These numbers let you measure the three oee factors and tie losses back to actual events.
Start with Planned Production Time, Good Count, and Ideal Cycle Time. Then add Stop Time, Run Time, and either Total Count or Reject Count. Once those pieces are in place, your oee data can show where machine downtime, speed loss, and defects are hurting output.
Availability: Measuring Uptime and Downtime
Availability tells you how much of planned production time the equipment was actually running. In simple terms, it compares uptime against the time the process was scheduled for production. If a machine is supposed to run but is not, that gap becomes an availability loss.
To measure it manually, define your planned production time first. Most teams start with shift time and exclude only breaks and meetings. Then record every downtime event that meets your chosen threshold. For manual systems, five minutes is a common cutoff for logging stop time.
This matters because machine downtime is often the first large source of lost capacity. Breakdowns, changeovers, and other recorded stops reduce the time available to produce. When stop reasons are clear and consistent, Availability gives you a direct view of where scheduled time is being lost.
Performance: Calculating Machine Speed and Productivity
Performance shows whether the process ran at the speed it should have reached while it was operating. It compares actual output to what the line could have produced at the ideal cycle time. That ideal should reflect the fastest honest rate the process can support, not a padded standard.
You can set ideal cycle time from nameplate capacity or from a time study if needed. Then compare total output during run time to the maximum possible speed. If output falls short even while the equipment is running, you have a performance loss.
This is where manual tracking gets hard. Slow cycles and brief interruptions rarely make it into shift notes. A machine may look busy all day but still run below target. That is why Performance is often the weakest part of manual OEE data and the easiest loss to miss.

Quality: Recording Good Parts Versus Defects
Quality measures how much of your output meets quality standards the first time through the process. For OEE, good parts should include only units that are defect-free without rework. That makes the metric closely tied to first pass yield and gives you a cleaner view of true output.
You can collect Quality data in one of two ways. Either measure Total Count directly or track reject count and add it to Good Count. The key is consistency. Record parts at the same point in the process each time so your oee quality number reflects real production, not mixed definitions.
Use a simple text table like this in your manual logs:
Metric
What to Record
Good Count
Parts that meet quality standards first pass
Reject Count
Defective units or scrap
Total Count
Good parts plus rejects
Notes
Startup rejects, recurring defect patterns
Beginner’s Guide: How to Start Manual OEE Tracking
If you are setting up manual oee for the first time, keep the first version simple. Pick one pilot area, define the numbers you need, and make data capture easy for operators during the shift. Good manual logs should support the work, not interrupt it.
From there, build a repeatable routine for oee tracking. Decide who records each item, when it gets entered, and how it is checked before review. The next sections walk through the tools, setup, and daily habits that make manual data collection workable.
What You Need: Tools, Templates, and Preparation
You do not need complex software to begin. Most teams start with spreadsheets, whiteboards, and a few paper forms. The goal is to make data collection visible, simple, and repeatable. Before launch, define the pilot area and identify the constraint, since that step limits throughput for the larger process.
It also helps to agree on the exact meaning of each field. If operators use different definitions for downtime, changeover, or good parts, your numbers will drift right away. Clear templates reduce that risk and make operator inputs easier during a busy shift.
A basic starter set often includes:
- A spreadsheet for calculations and daily summaries
- A whiteboard for shift-level visibility
- A stop reason tick sheet
- A stop event log form
- A project organizer for setup decisions
Step-by-Step Process for Manual OEE Data Collection
A strong manual tracking process is less about paperwork and more about consistency. Your team needs one agreed method for recording counts, stops, and reasons. If each shift follows a different routine, the oee calculation will be unstable and hard to compare from day to day.
Start small, then tighten the process as the team learns. Many plants see better results when they keep the first rollout limited to one machine or line. That gives supervisors time to spot gaps in manual logs before expanding to a larger area.
A practical sequence looks like this:
- Set up the spreadsheet or whiteboard
- Define recording intervals and stop thresholds
- Collect oee data the same way every shift
- Review entries before calculation
- Compare trends and top losses regularly
Step 1: Set Up Your Spreadsheet or Whiteboard
Begin by creating one clear place for manual data collection. Some teams prefer spreadsheets for formulas and reporting. Others use whiteboards on the line for live visibility, then transfer results into a spreadsheet at the end of the shift. Either approach can work if the fields match exactly.
Your templates should include Planned Production Time, Stop Time, Run Time, Good Count, Total Count or Reject Count, and Ideal Cycle Time. Add space for stop reasons and comments. Keep the layout simple enough that operators can complete it quickly without guessing where each entry belongs.
Most important, place the form or board where the work happens. If people have to leave the area to update oee data, entries get delayed or skipped. A good setup reduces friction and makes the first week of tracking much easier to manage.
Step 2: Define Your Data Recording Intervals
Next, decide how often the team will update the record. For manual systems, shorter intervals usually produce better data capture because details are still fresh. Waiting until the end of shift time invites missing entries, rounded stop durations, and vague explanations.
Your intervals should match the pace of the process. Some teams review by hour, others by break, and others by work order or shift segment. The key is that the timing stays fixed. Oee tracking becomes more reliable when every operator knows exactly when counts and losses must be recorded.
Also separate shift time from calendar time. OEE uses scheduled production time, not all hours in the day. That means you should define what is included and excluded before recording begins. Breaks and meetings are commonly excluded so the team measures production against the right yardstick.
Step 3: Collect and Record Data Consistently
Once the system is live, consistency matters more than speed. Every shift should record the same fields, in the same order, using the same rules. Good oee data depends on disciplined manual entry, especially when operators are balancing production demands at the same time.
Common mistakes usually come from rushed operator inputs. Teams forget to log a stop, use unclear reason codes, combine several events into one entry, or estimate counts after the fact. Those habits weaken data capture and make the final score harder to trust. Small gaps also distort loss data more than many teams expect.
A simple review routine helps. Check forms during the shift, not just after it ends. Make sure the entries are legible, complete, and tied to actual events. When the process is corrected early, your manual system stays useful for much longer.
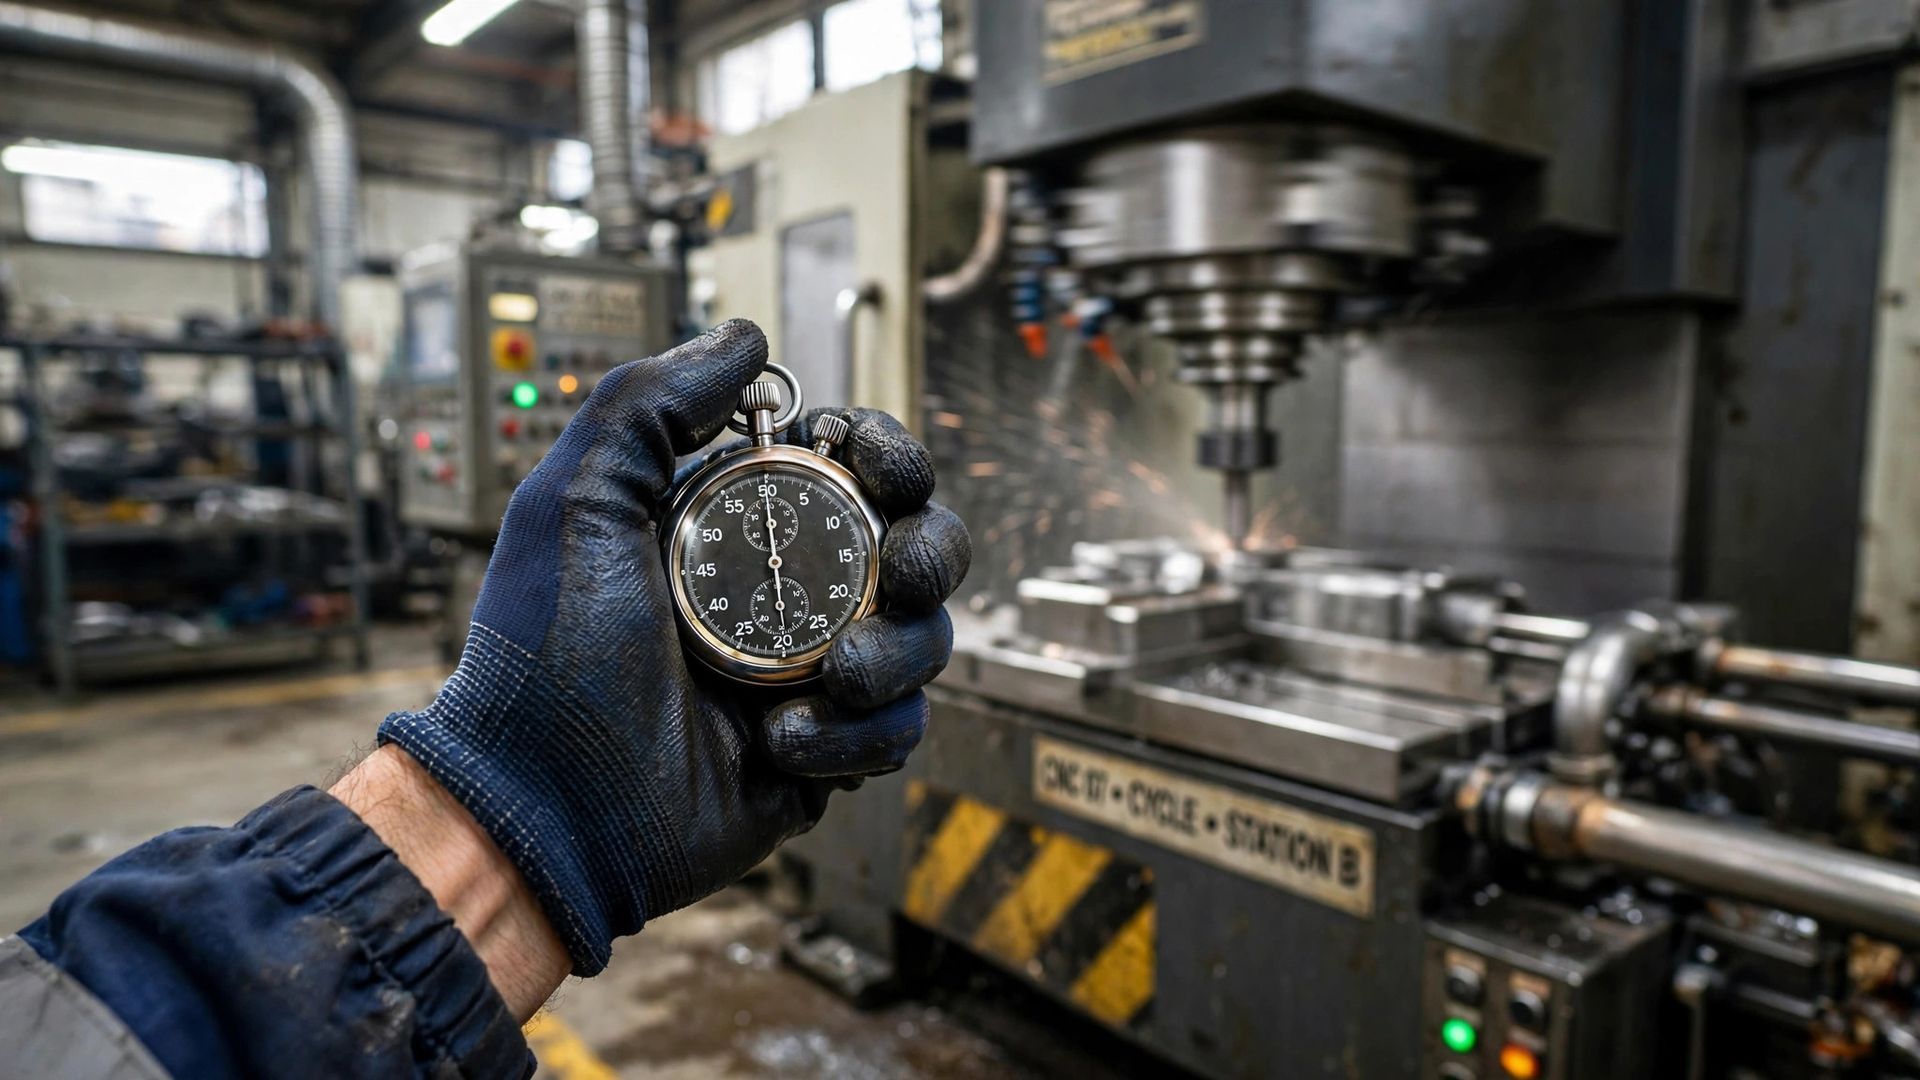
Step 4: Calculate and Review OEE Metrics
After data is collected, calculate the three oee factors separately before multiplying them into one oee score. Availability is based on planned time and run time. Performance compares output to ideal rate. Quality compares good parts to total count. Keeping the factors separate helps your team see which loss category is driving the result.
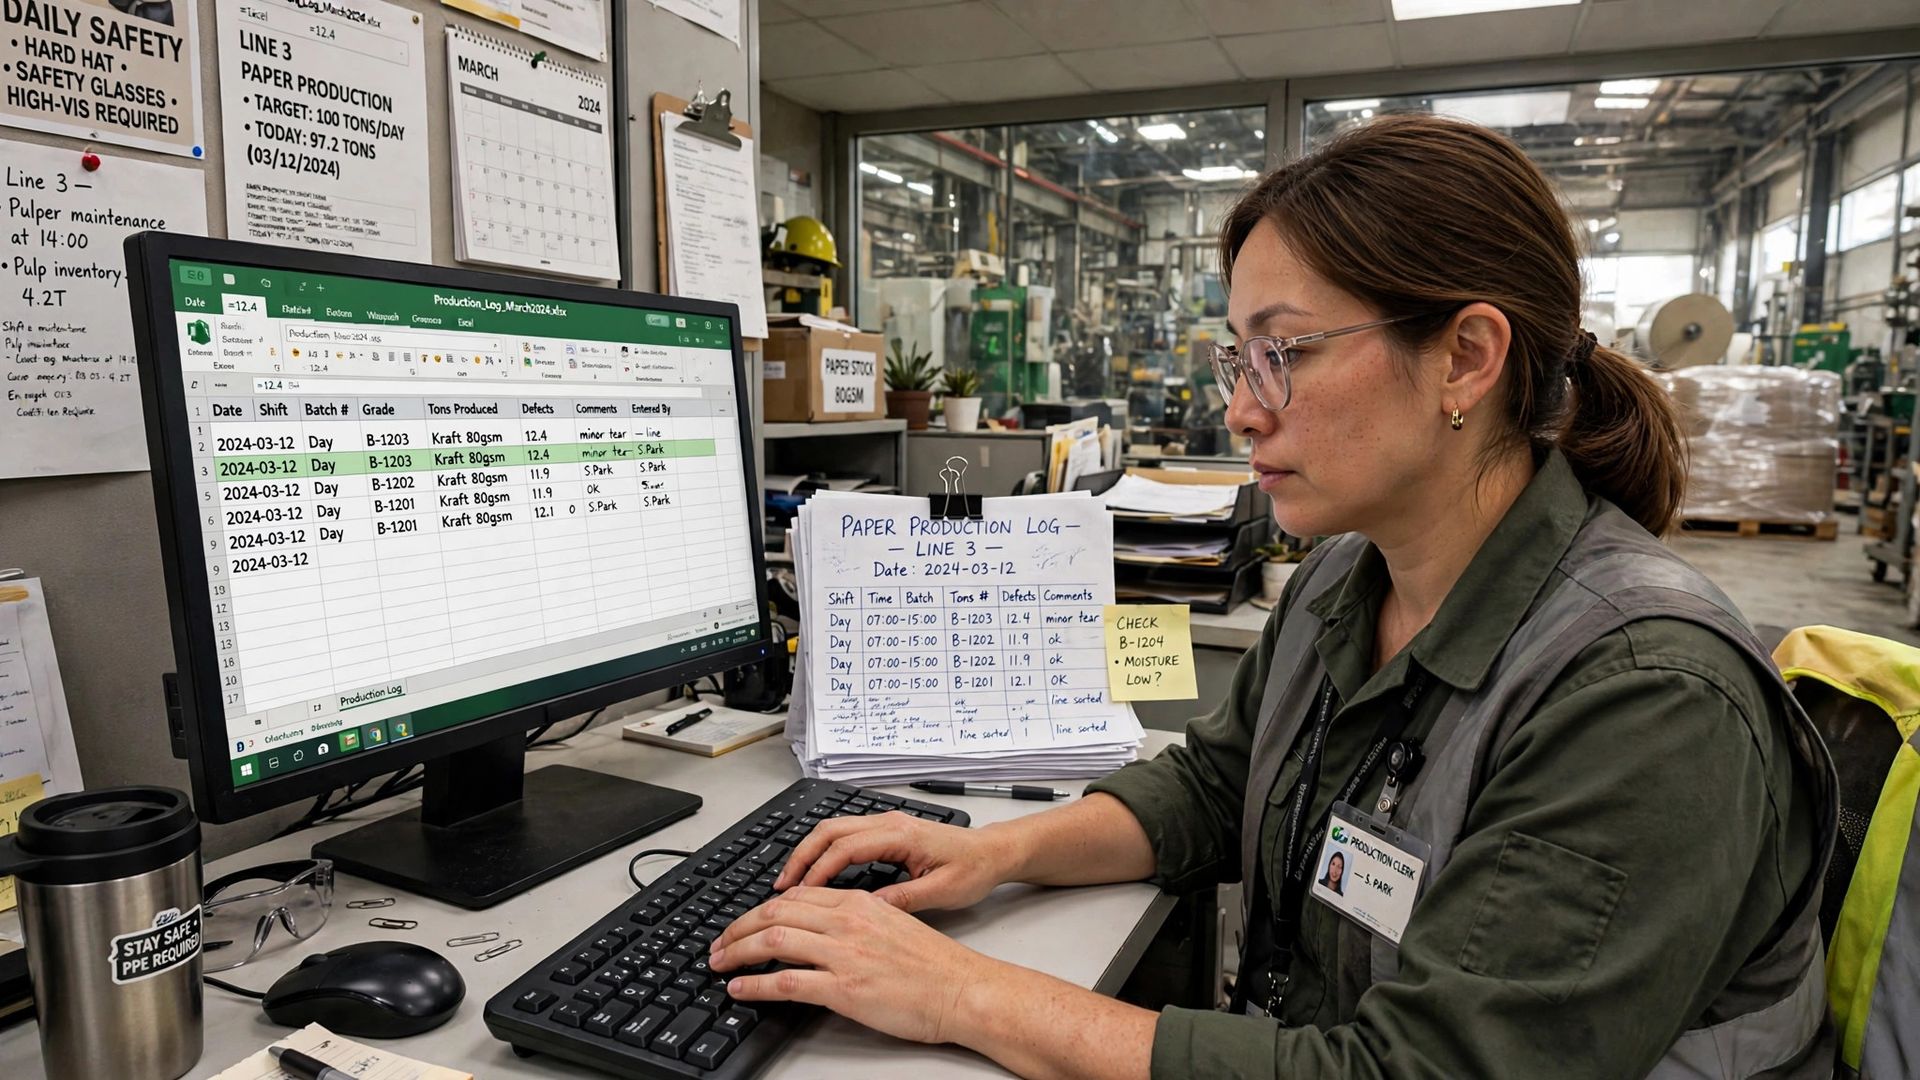
This is the best way to track OEE manually without specialized software. Use a spreadsheet to handle the formulas, but review the source entries first. A correct formula does not fix a weak log. If the run time or counts are off, the final number will still mislead you.
Then review trends, not just one day’s result. Ask where the biggest losses came from, which stop reasons repeat, and whether the score matches what supervisors saw on the floor. If not, your measurement method may need to change. For a broader view of what good OEE should support, see https://www.empoweredautomation.com/oee
Conclusion
In conclusion, manual OEE tracking using spreadsheets and whiteboards can be a practical approach for manufacturing managers seeking to measure efficiency in their processes. While it offers flexibility and ease of use, there are moments when this method falls short, such as when the data becomes unwieldy or prone to human error. Recognizing the signs that indicate it’s time to transition to automated OEE tracking is crucial for continuous improvement. For a deeper dive into optimizing your OEE processes, visit our comprehensive OEE pillar page at https://www.empoweredautomation.com/oee. Embrace the tools that serve you best, and take the next step toward enhancing your manufacturing efficiency today!
Frequently Asked Questions
How often should I update manual OEE data for accuracy?
Update oee data at fixed points during the shift, not only at the end. Manual oee works better when data collection happens while events are still fresh. Use intervals that fit your process, but keep them consistent. Remember, oee tracking is based on scheduled production time, not total calendar time.
What are the most common mistakes with manual OEE tracking?
The biggest issues are missed stops, rounded times, unclear reason codes, and delayed manual entry. In manual tracking, people also tend to miss short interruptions and speed losses. That creates incomplete oee data and weak loss data, even when the spreadsheet formulas themselves are correct.
In which industries is manual OEE tracking still widely used?
Manual tracking is still used in plants that are early in their oee tracking journey and want to start with a pilot machine, cell, or line. It fits a simpler manufacturing process where the shop floor team can observe events directly and maintain manual oee logs without too much complexity.
How can I tell when it’s time to move from manual to automated OEE tracking?
It is time to change when your team misses short stops, spends too much time compiling reports, or no longer trusts the numbers. If manual oee cannot support timely data collection or clear action in your manufacturing process, automated tracking becomes the better next step.
You might also like