OEE Software vs Spreadsheets: When to Make the Switch
Key Highlights
- Spreadsheets can work for early overall equipment effectiveness tracking when data collection is simple.
- OEE software gives you faster visibility into losses by using machine data instead of delayed manual updates.
- Many plants outgrow spreadsheets when human error, version control, and missed downtime start hurting decisions.
- Real-time dashboards support continuous improvement better than end-of-shift reports built in spreadsheets.
- Switching makes sense when production teams need reliable numbers across lines, shifts, and departments.
- For a broader look at OEE, see the OEE pillar page: https://www.empoweredautomation.com/oee
Introduction
If you track equipment effectiveness today, you have likely asked a fair question: is a spreadsheet still enough, or is it time for oee software? Overall equipment effectiveness is simple in concept, but getting reliable numbers from a busy shop floor is harder than it looks. As production grows, the way you collect and review losses can shape every improvement effort. This guide compares both approaches fairly, so you can decide what fits your plant now and what will support it next.
Understanding OEE Tracking: Spreadsheets vs. Software
At a basic level, both spreadsheets and an oee system aim to organize oee data so you can see how well the production process is running. The difference is how the data collection happens and how quickly you can trust what you see.
With spreadsheets, teams often rely on paper logs, shift reports, and manual entry at the end of a shift. Oee software connects to machine signals, tracks events in real time, and turns raw inputs into dashboards, alerts, and reports. That shift from manual collection to automated visibility changes how quickly you spot losses and act on them.
What is Overall Equipment Effectiveness (OEE) and Why Track It?
Overall equipment effectiveness is an oee metric used to measure how well a machine or process performs during scheduled production. It gives you one view of equipment performance by combining three factors: availability, performance, and quality. Because it uses a standard calculation, it helps teams compare losses over time.
The oee formula is straightforward: OEE = Availability x Performance x Quality. Availability looks at run time compared with planned production time. Performance compares actual output with the ideal cycle time or standard speed. Quality measures good parts against total parts produced.
Why track it? Good data collection helps you see where time, speed, and product quality are slipping. When the numbers are reliable, overall equipment effectiveness supports better priorities, stronger root causes analysis, and more focused continuous improvement across the shop floor.
How OEE Measurement Usually Starts in Manufacturing Plants
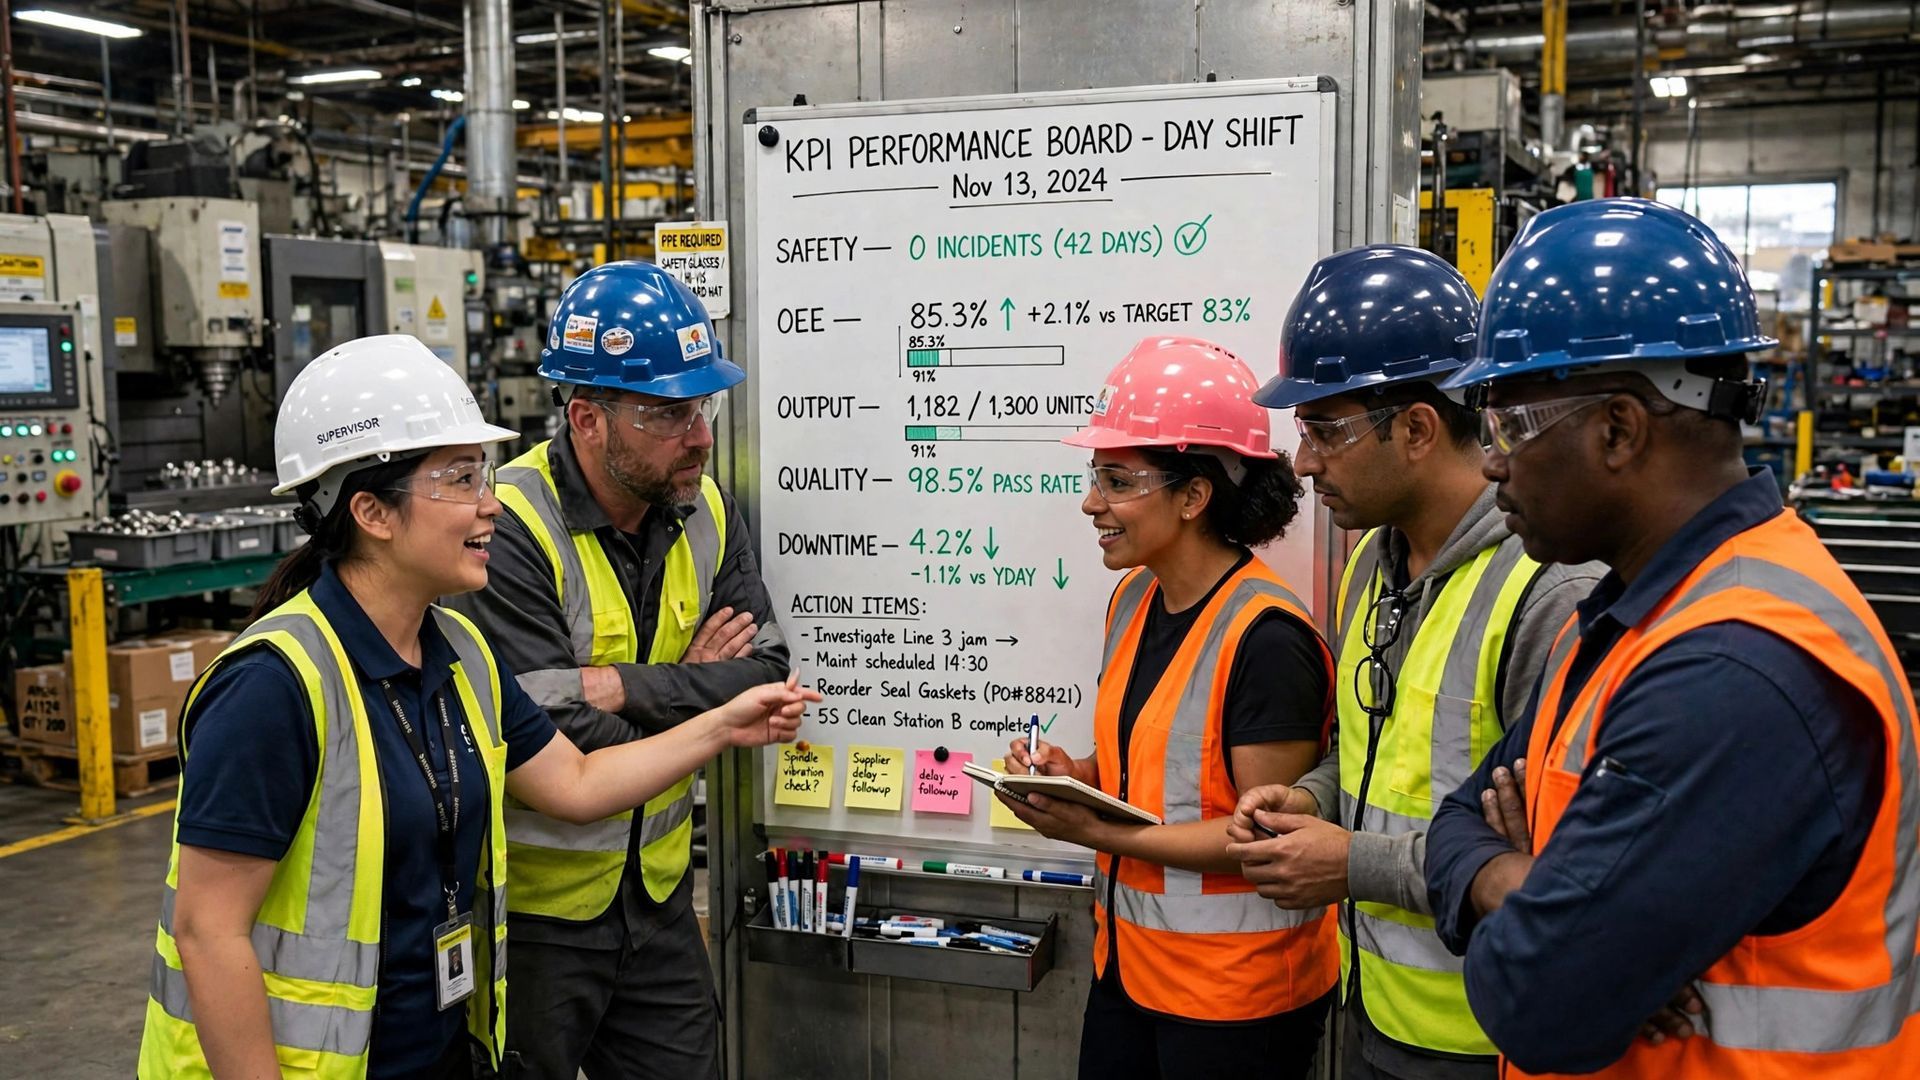
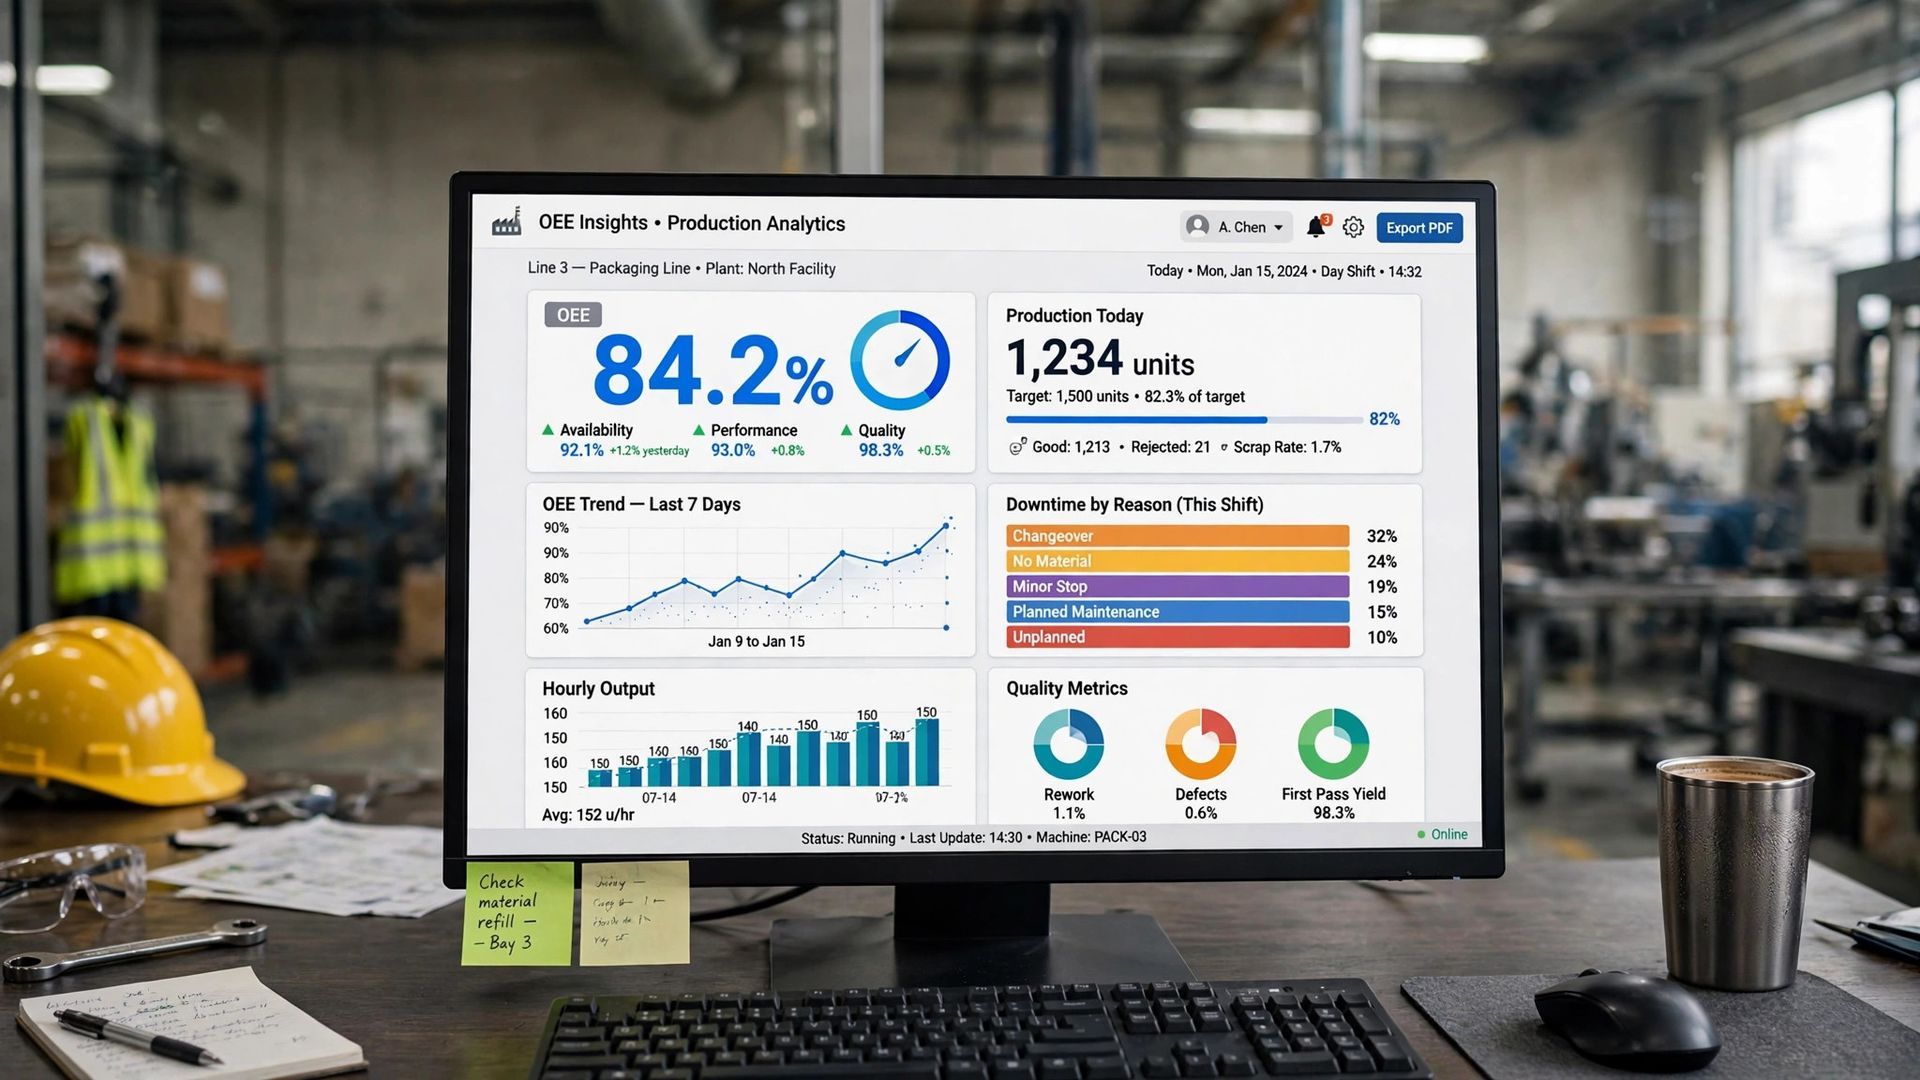
In many plants, OEE starts small. A supervisor wants better visibility, so the team begins manual oee tracking using paper logs, whiteboards, or simple spreadsheets. Operators note stop time, output, and scrap, then someone rolls that information into shift reports.
That approach can be practical at first. It keeps costs low and helps teams learn the formula, the loss categories, and the oee value for one machine or one line. For a limited scope, spreadsheets are often good enough to prove that measuring performance matters.
The trouble begins when production data grows. More machines, different shifts, and more product mix mean more files, more data entry, and more chances to miss short stops or classify losses differently. That is usually the point where manufacturers start to outgrow spreadsheets and look for a dedicated system.
Comparing Data Collection Methods
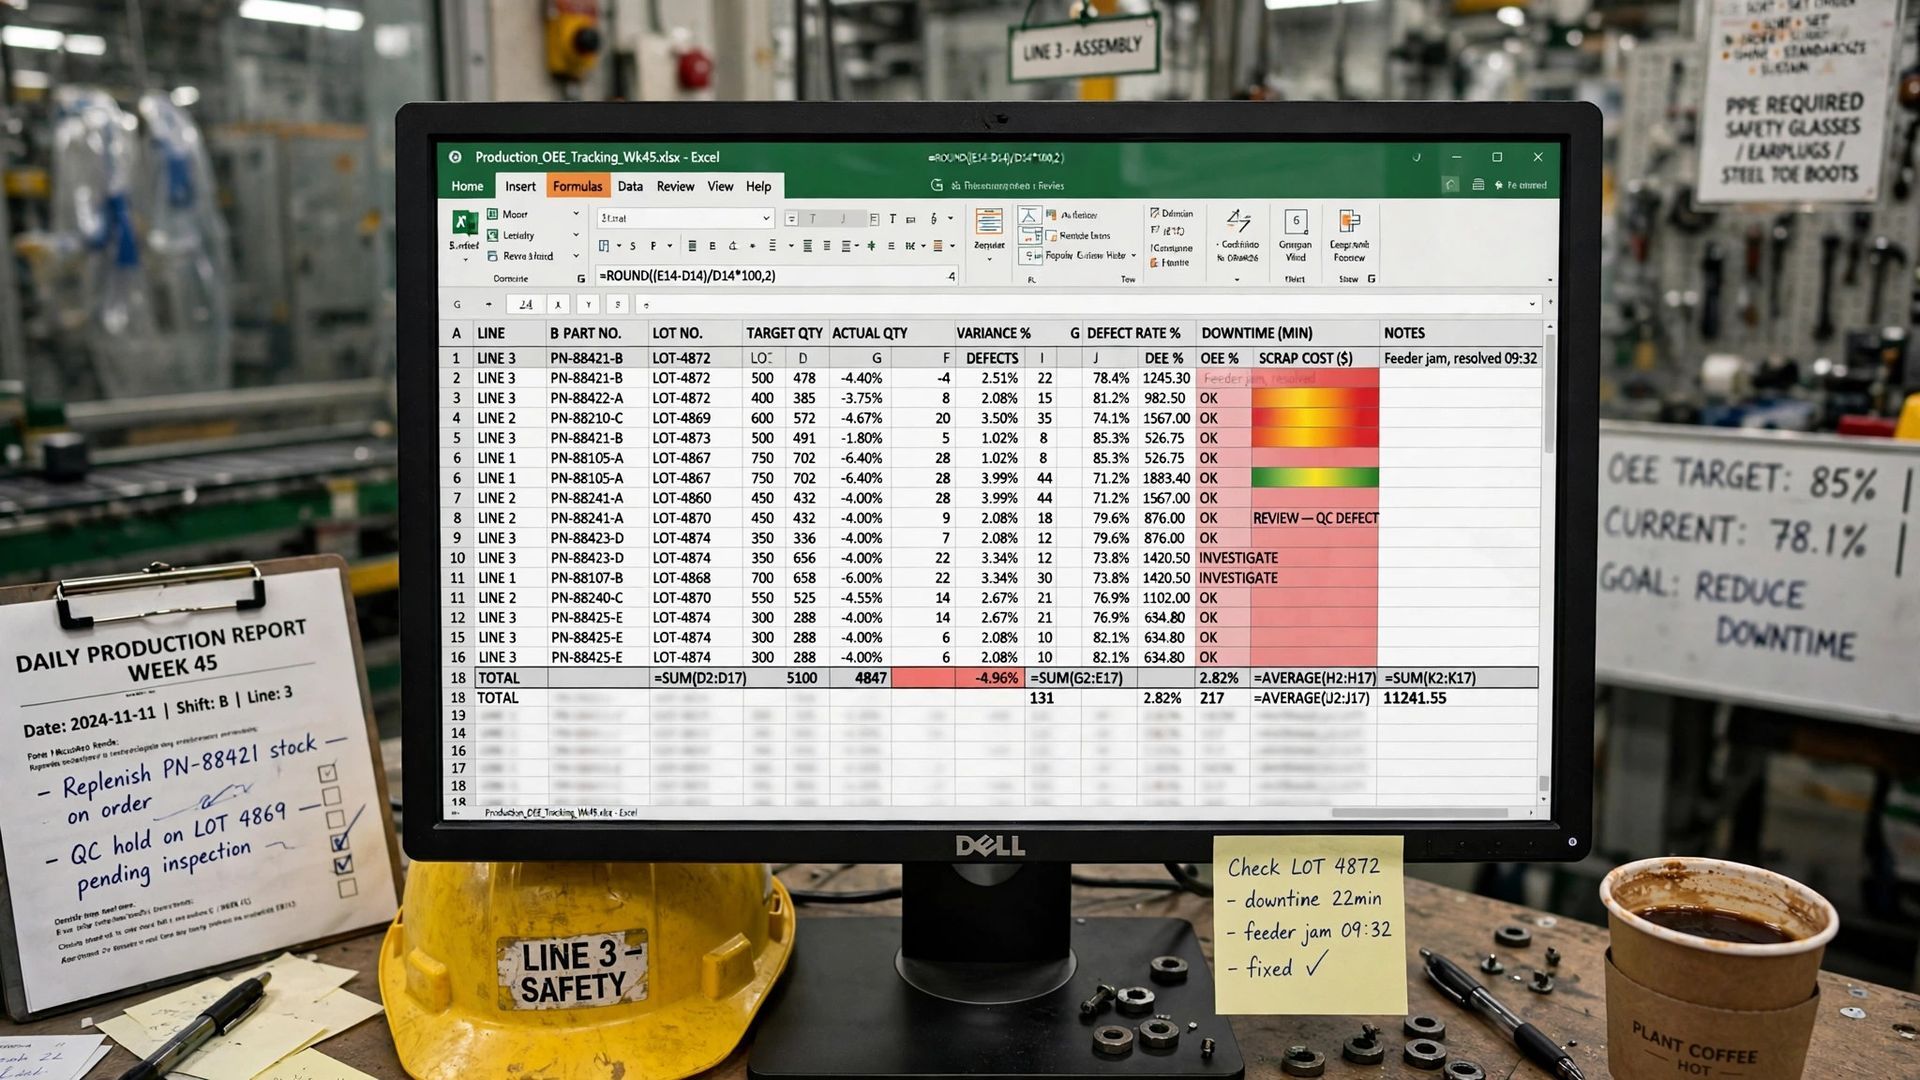
The biggest practical difference is data collection. Spreadsheet-based tracking usually depends on people recording run time, production time, and downtime after the fact. That means your team may not see a problem until hours later.
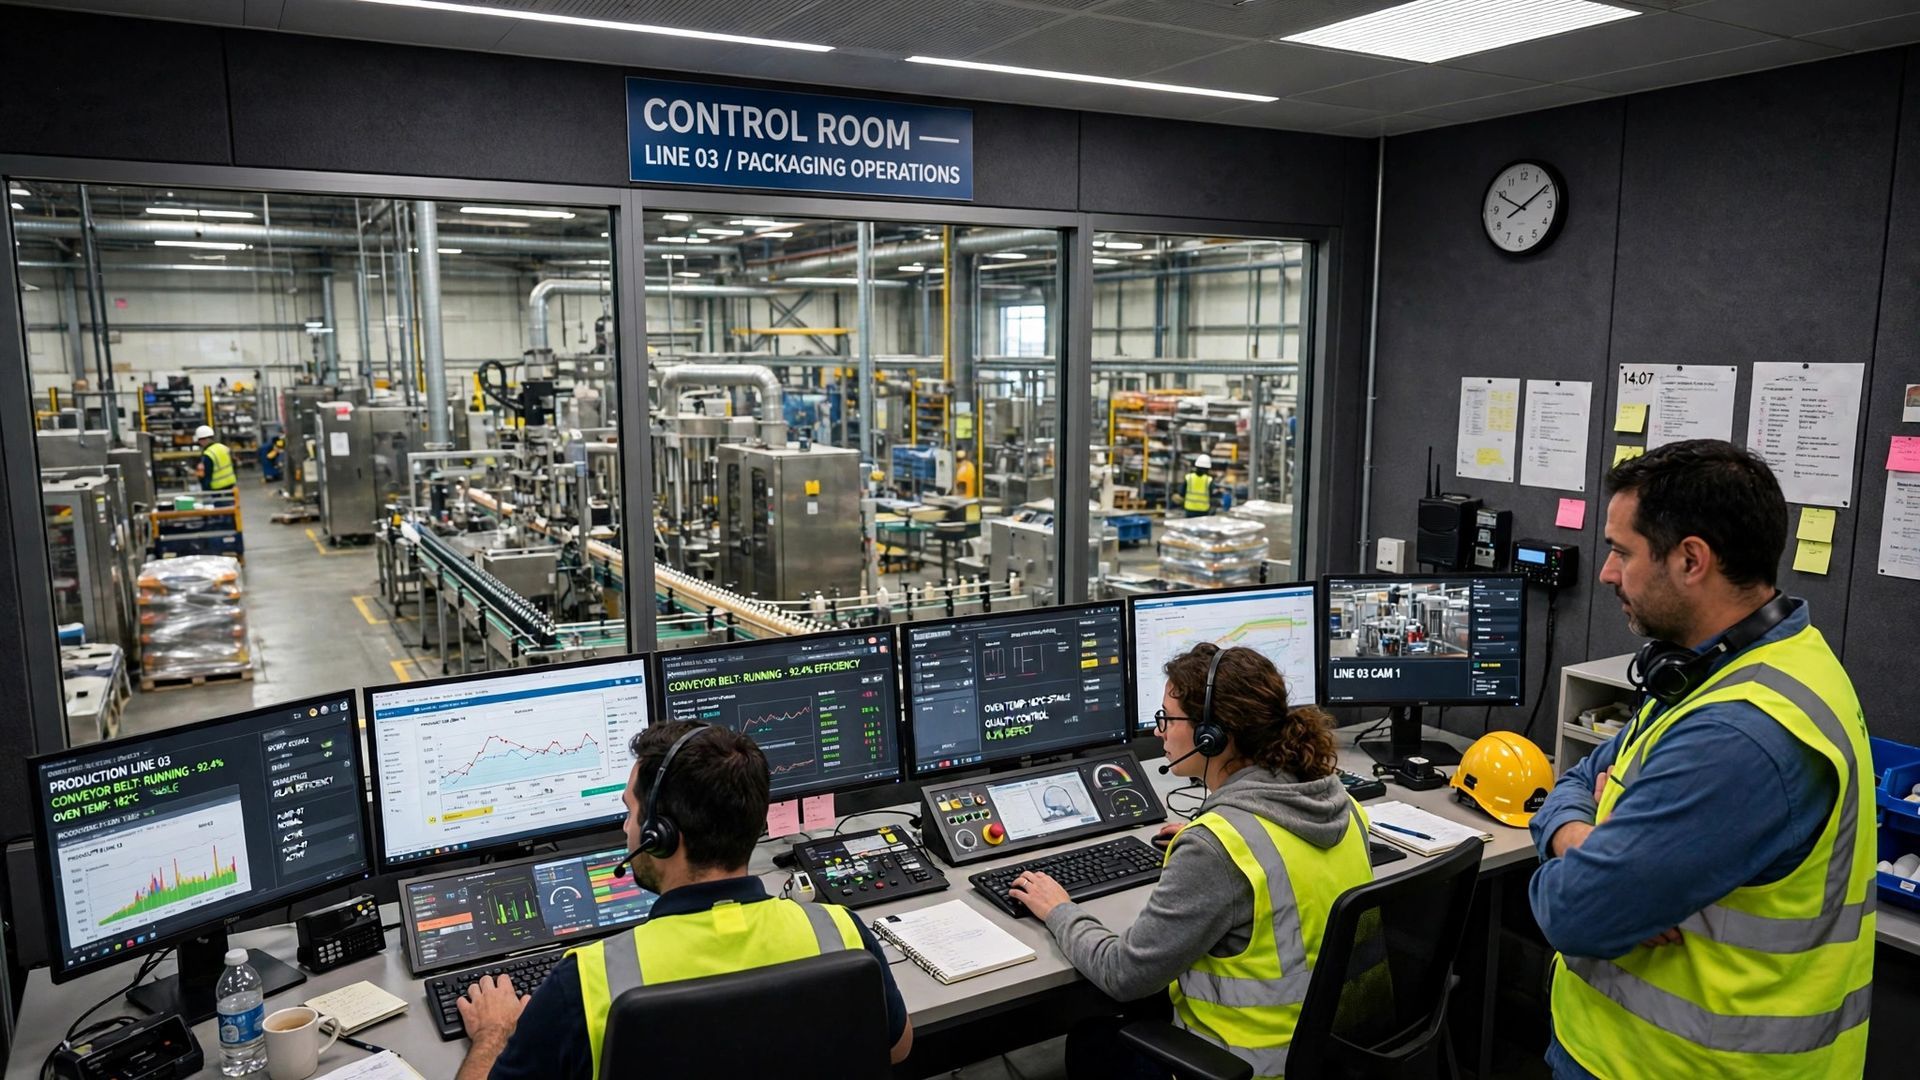
An automated approach pulls machine data from sensors, PLCs, or interfaces and updates performance in real time. Instead of waiting for a report, you can see stop events, speed loss, and output changes as they happen. That real-time view is what makes faster loss detection possible, and it sets up the tradeoffs in the next two sections.
Manual Spreadsheet Approaches: Flexibility and Familiarity
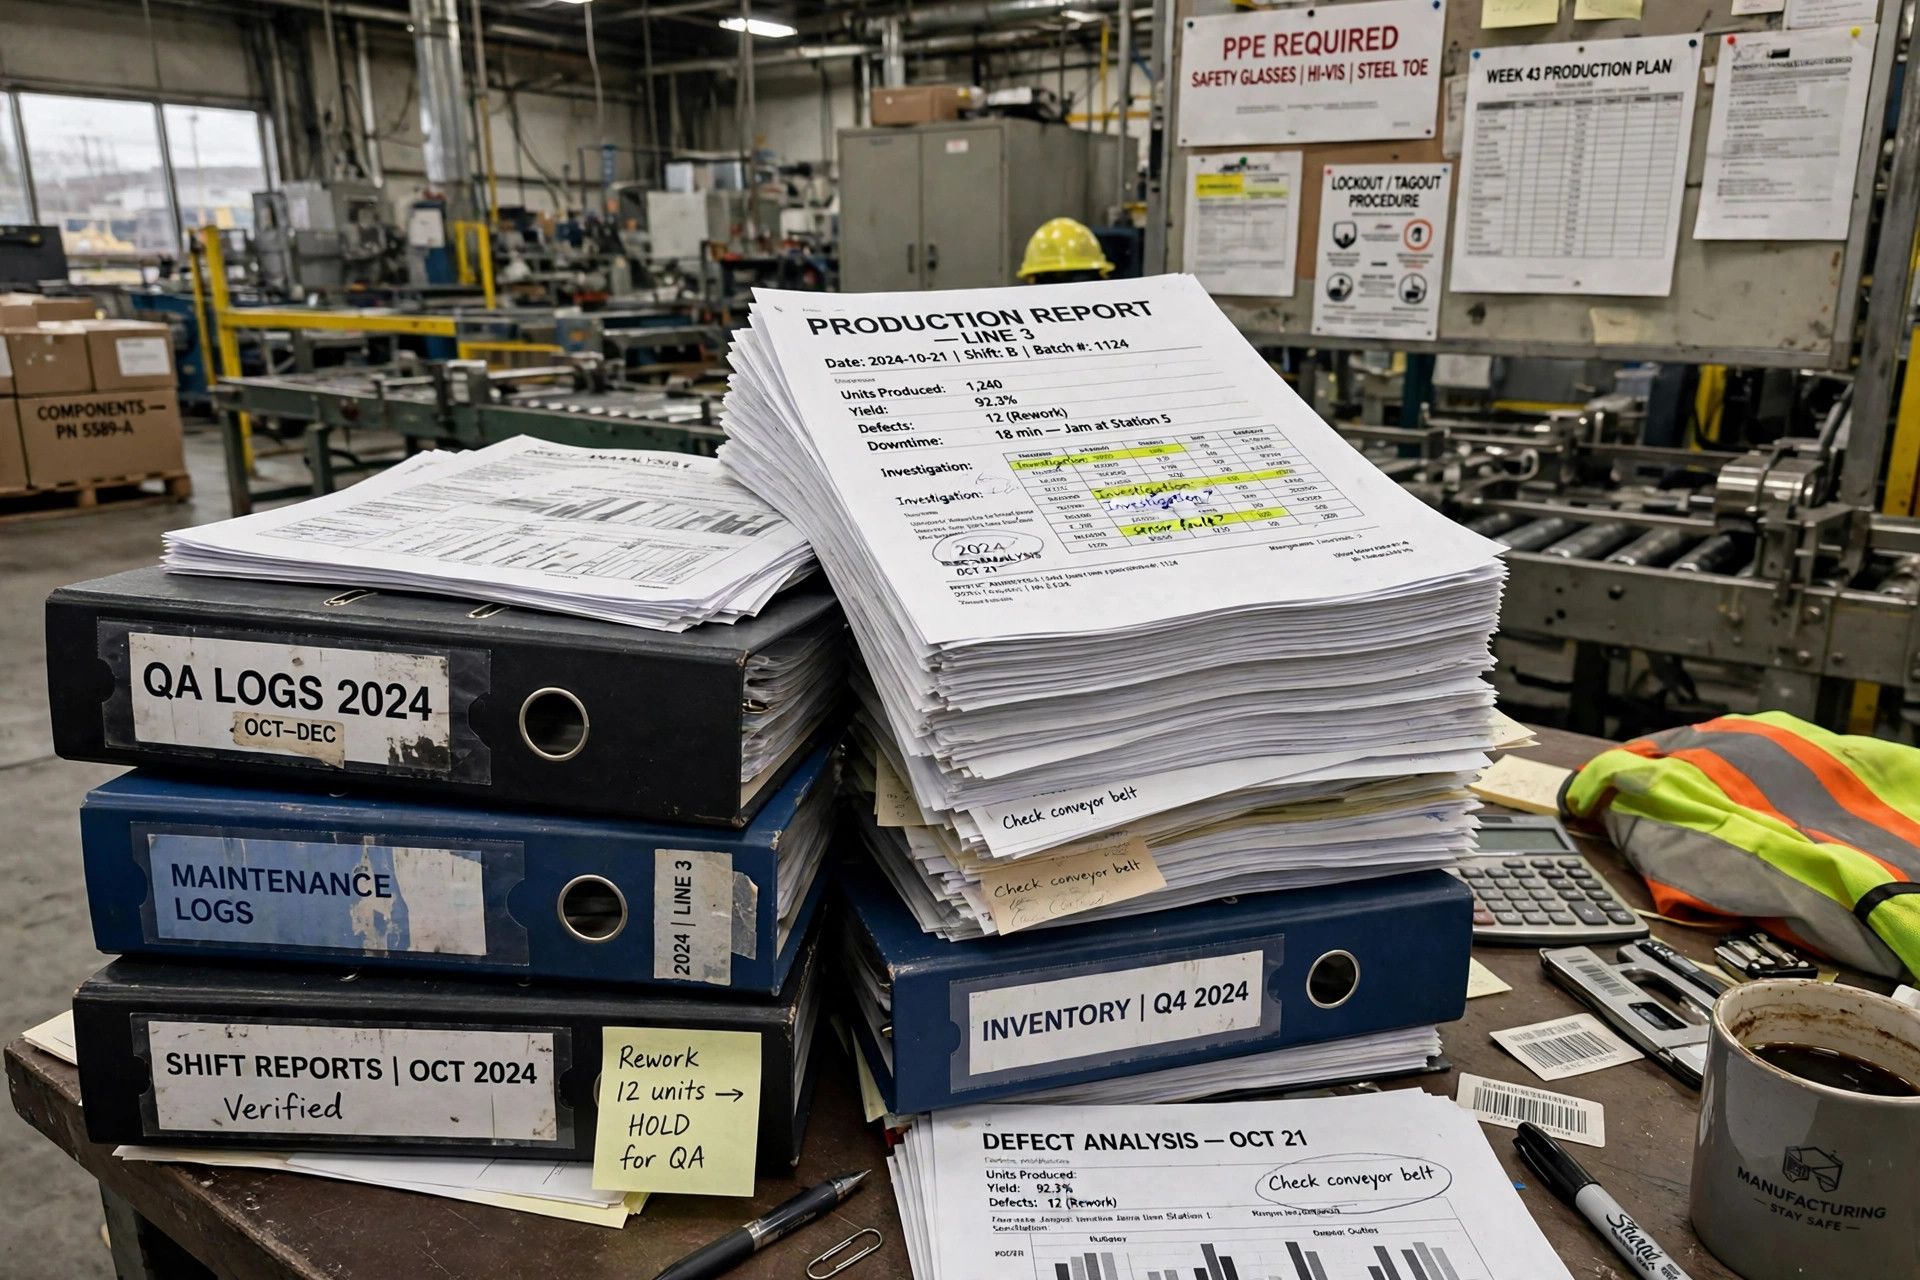
Spreadsheets stay popular for a reason. Most teams already know Excel, so setup feels fast and low risk. If you are testing manual oee tracking on one asset, spreadsheets can calculate OEE efficiently enough. You can build formulas, track counts, and create basic charts without buying new software.
They also give you flexibility. You can change fields, add comments, and tailor sheets to your line. For early efforts, that familiarity helps plants get started before they commit to a larger oee system.
Still, the limits show up as the workload increases:
- Data entry takes time and often happens after production events.
- Human error can affect formulas, timestamps, and loss categories.
- Short stops may be missed when operators are busy.
- Multiple spreadsheet versions can create confusion about which numbers are correct.
Automated OEE Software: Real-Time Data and Streamlined Processes
Oee software is built to reduce manual effort and improve visibility. It connects to equipment, collects machine data automatically, and applies the standard calculation without depending on end-of-shift updates. That means the data reflects what is happening now, not what someone remembers later.
For manufacturing managers and engineers, the real advantage is speed. When a machine stops, runs slow, or produces scrap, the system can record the event in real time and feed it to dashboards, reports, and alerts. Many platforms also include oee modules that link performance with maintenance, ERP, or MES data.
Key strengths usually include:
- Real-time monitoring of stop events, counts, and cycle behavior
- Centralized dashboards that make trends easier to read
- Less manual handling across shifts and production lines
Where Spreadsheets Fall Short for OEE Monitoring
Most plants do not abandon spreadsheets because spreadsheets are bad. They move on because the cost of weak data accuracy and slow updates becomes too high. Once you depend on OEE to guide improvement, shaky inputs can distort what you think is happening on your production equipment.
That is the core issue. If oee data is late, incomplete, or inconsistent, you can misread production performance and chase the wrong problem. The next sections show where data reliability, collaboration, and scaling usually start to break down.
Common Limitations in Data Accuracy and Reliability
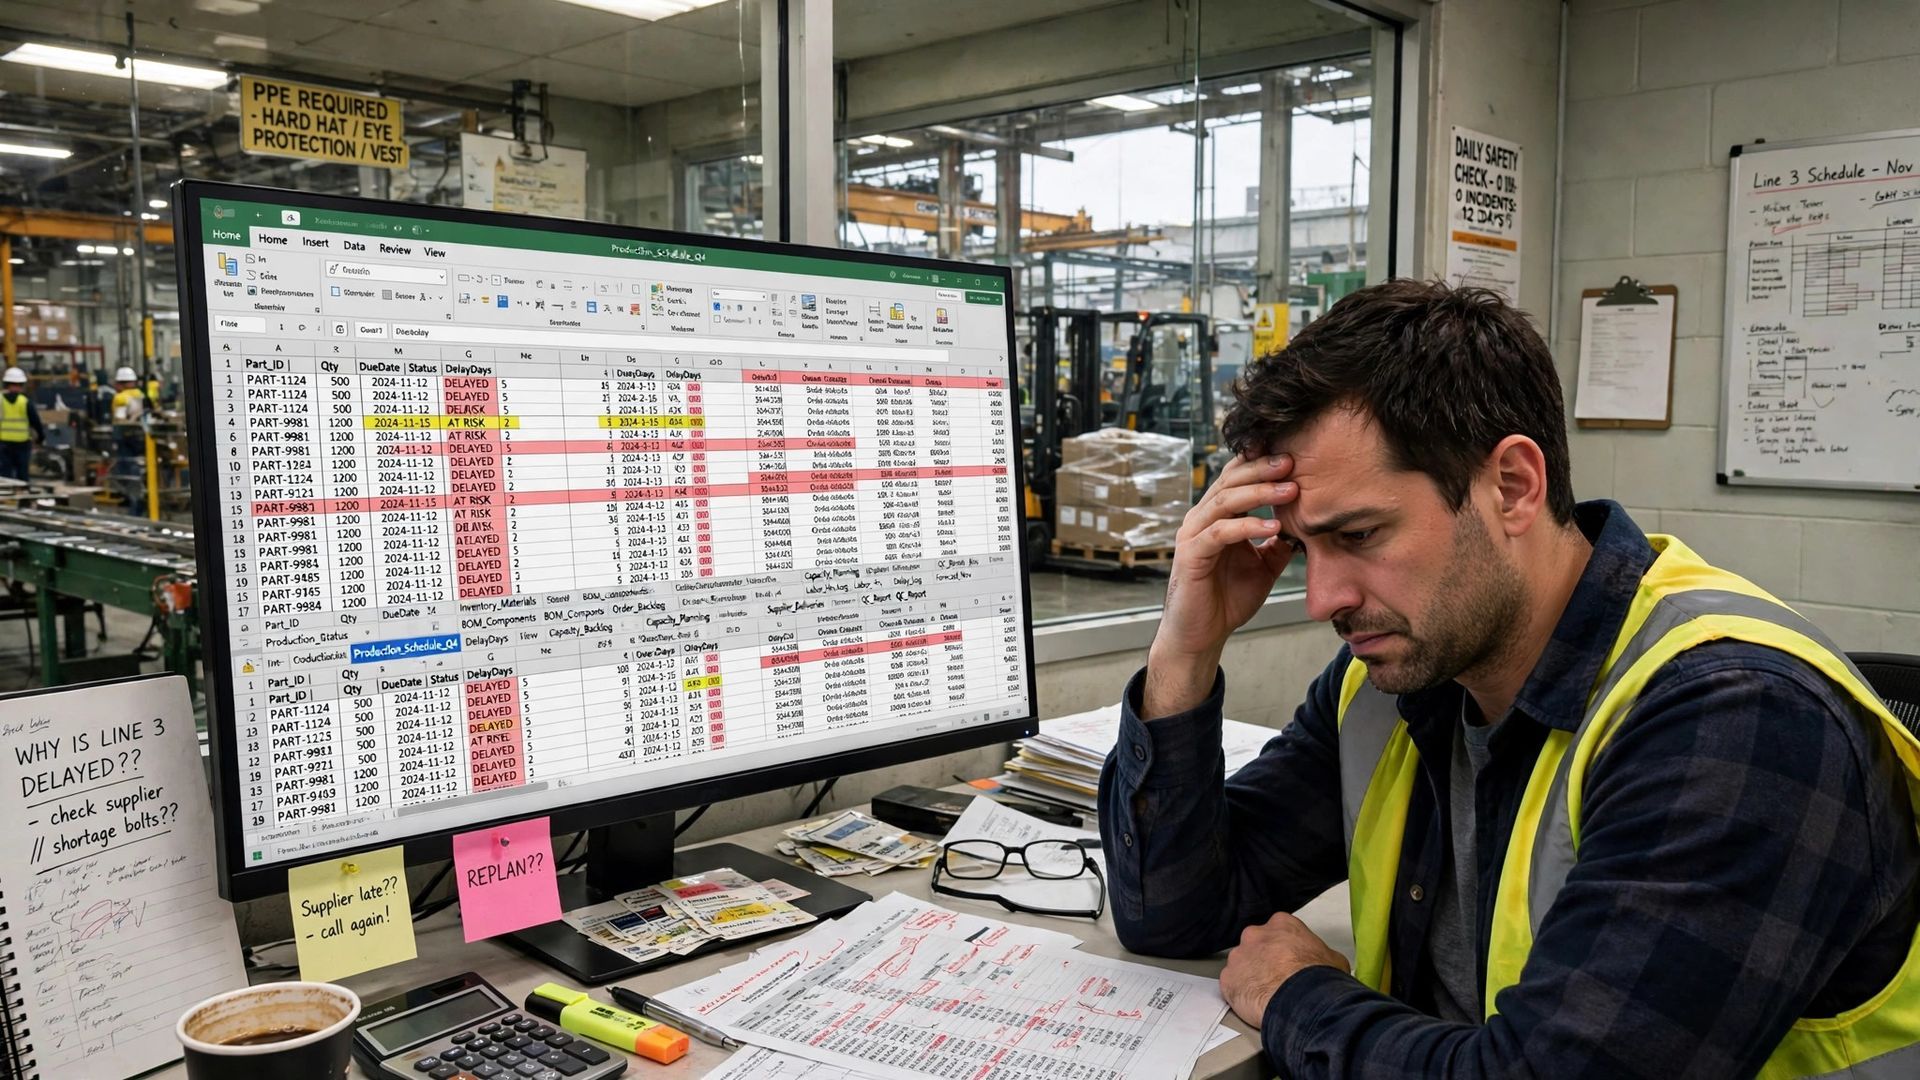
Manual systems often struggle with data accuracy because people are busy running production, not documenting every event. Small stops can be missed, downtime can be estimated later, and output totals may not match across reports. When that happens, the plant loses confidence in the numbers.
Another issue is classification. If stop reasons are broad or inconsistent, the total downtime may be recorded, but the root causes stay unclear. That weakens follow-up work because teams cannot see which losses truly deserve attention.
Issue
Spreadsheet Impact
Software Advantage
Delayed data entry
Events may be recorded from memory at the end of a shift
Timestamps are captured automatically
Missed short stops
Micro-downtime is often overlooked
Frequent small stops can be recorded
Inconsistent categories
Broad labels hide root causes
Standard loss lists improve analysis
Output mismatches
Counts may differ across files
Centralized inputs improve reliable numbers
Challenges With Collaboration, Scaling, and Error Prevention
A spreadsheet might work on one line with one owner. Problems show up when more teams need the same numbers. Production, maintenance, and quality may each track different pieces in separate files, which makes collaboration harder and slows down decision-making.
Scaling adds even more friction. As production lines, products, and shifts increase, plants spend much effort reconciling timestamps, formulas, and file versions. That raises the chance of human error and makes it harder to compare lines fairly.
Common pressure points include:
- Separate files for different departments with no shared source of truth
- Weak data integration with MES, ERP, or machine signals
- More manual checking as the plant expands
The transition to software does take planning, but the compiled information shows many plants begin with one machine or line, then expand once the process is standardized.
Signs Your Plant is Ready to Switch to OEE Software
The clearest sign is not that spreadsheets fail completely. It is that they stop supporting the way your plant runs. If your team cannot trust the numbers quickly enough to address performance issues, your measurement method is now part of the problem.
At that stage, oee software becomes less of a luxury and more of a practical tool for continuous improvement. When production equipment is generating more data, more events, and more complexity than manual methods can handle, it is time to look at specific triggers.
Triggers Indicating Spreadsheets Are Creating Inefficiencies
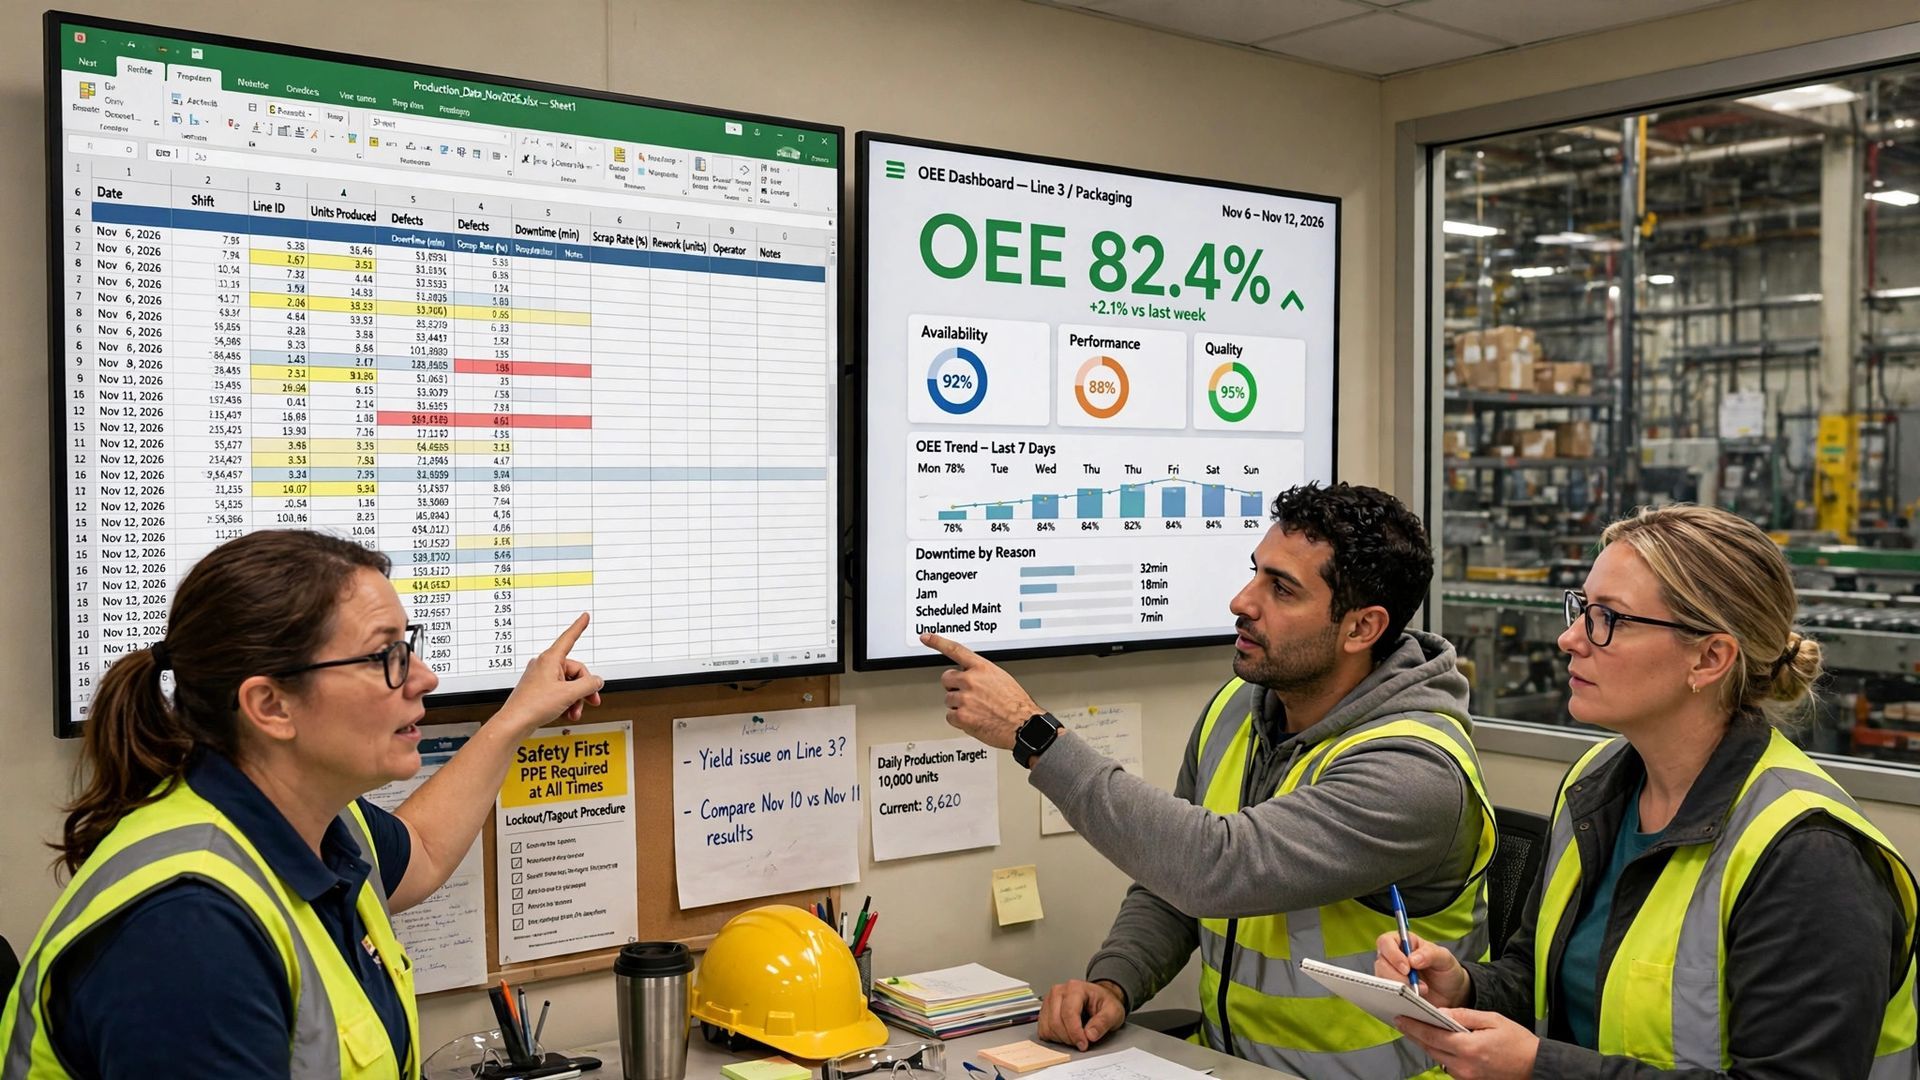
Many plants hold onto manual oee tracking longer than they should because the sheet still opens and the formula still works. But if your team spends more time fixing numbers than improving the line, the system is creating inefficiencies.
Watch for operational signs, not just frustration. If downtime data is entered late, if planned production time is defined differently by shift, or if departments cannot agree on the same loss, your OEE process is no longer stable enough to guide action. That can raise production costs by hiding real waste.
Common triggers include:
- Frequent debate over whether the OEE number is correct
- Missed short stops and unplanned downtime between reports
- End-of-shift data cleanup that delays response
- Separate files for output, scrap, and downtime that do not align
Key Benefits You Gain When Upgrading to OEE Software
Upgrading to oee software gives you more than automation. It gives you a cleaner operating rhythm. Instead of waiting for reports, your team can work from real time information and focus on action. That is especially useful when production speed, downtime, and quality losses change through the day.
You also gain structure. A good system standardizes loss categories, applies the ideal cycle time consistently, and gives operators, engineers, and managers one place to review performance. If you want a broader overview of what OEE should support, the pillar page is worth reviewing: https://www.empoweredautomation.com/oee
Look for benefits such as:
- Real-time dashboards instead of a static oee dashboard template
- Easier integration with MES, ERP, and machine connections
- Stronger analysis of loss patterns and stop reasons
- Better visibility across lines, shifts, and facilities
Conclusion
In summary, the transition from spreadsheets to OEE software can significantly enhance your manufacturing processes. While spreadsheets offer familiarity and flexibility, they often fall short in real-time data accuracy and collaboration capabilities. If you're noticing inefficiencies, such as increased errors or difficulties in scaling operations, it may be time to consider a switch to dedicated OEE software. Not only does this upgrade streamline your data collection and reporting, but it also provides you with actionable insights that can drive productivity and efficiency. For more detailed information on how OEE software can transform your operations, explore our comprehensive OEE pillar page here.
You might also like