OEE Benchmarks: What Is a Good OEE Score in Manufacturing?
Key Highlights
- OEE benchmarks help you judge whether your oee score is low, typical, strong, or approaching world class.
- A solid oee calculation breaks results into availability, performance, and quality so you can see where losses start.
- In many plants, 60% is typical, 70% shows strong progress, and 85%+ is widely treated as world class.
- Industry benchmarks vary by sector, process type, and plant baseline.
- The real value of OEE is continuous improvement, not chasing one number without context.
Introduction
If you run a plant, lead maintenance, or support production engineering, you have probably asked a simple question: what is a good OEE score? Overall equipment effectiveness gives you a practical way to measure how much of your manufacturing process is truly productive. But one number alone can mislead. A strong OEE score depends on your baseline, your industry, and your biggest production losses. This guide explains the ranges, the meaning behind them, and how to use them wisely.
Understanding OEE in Modern Manufacturing
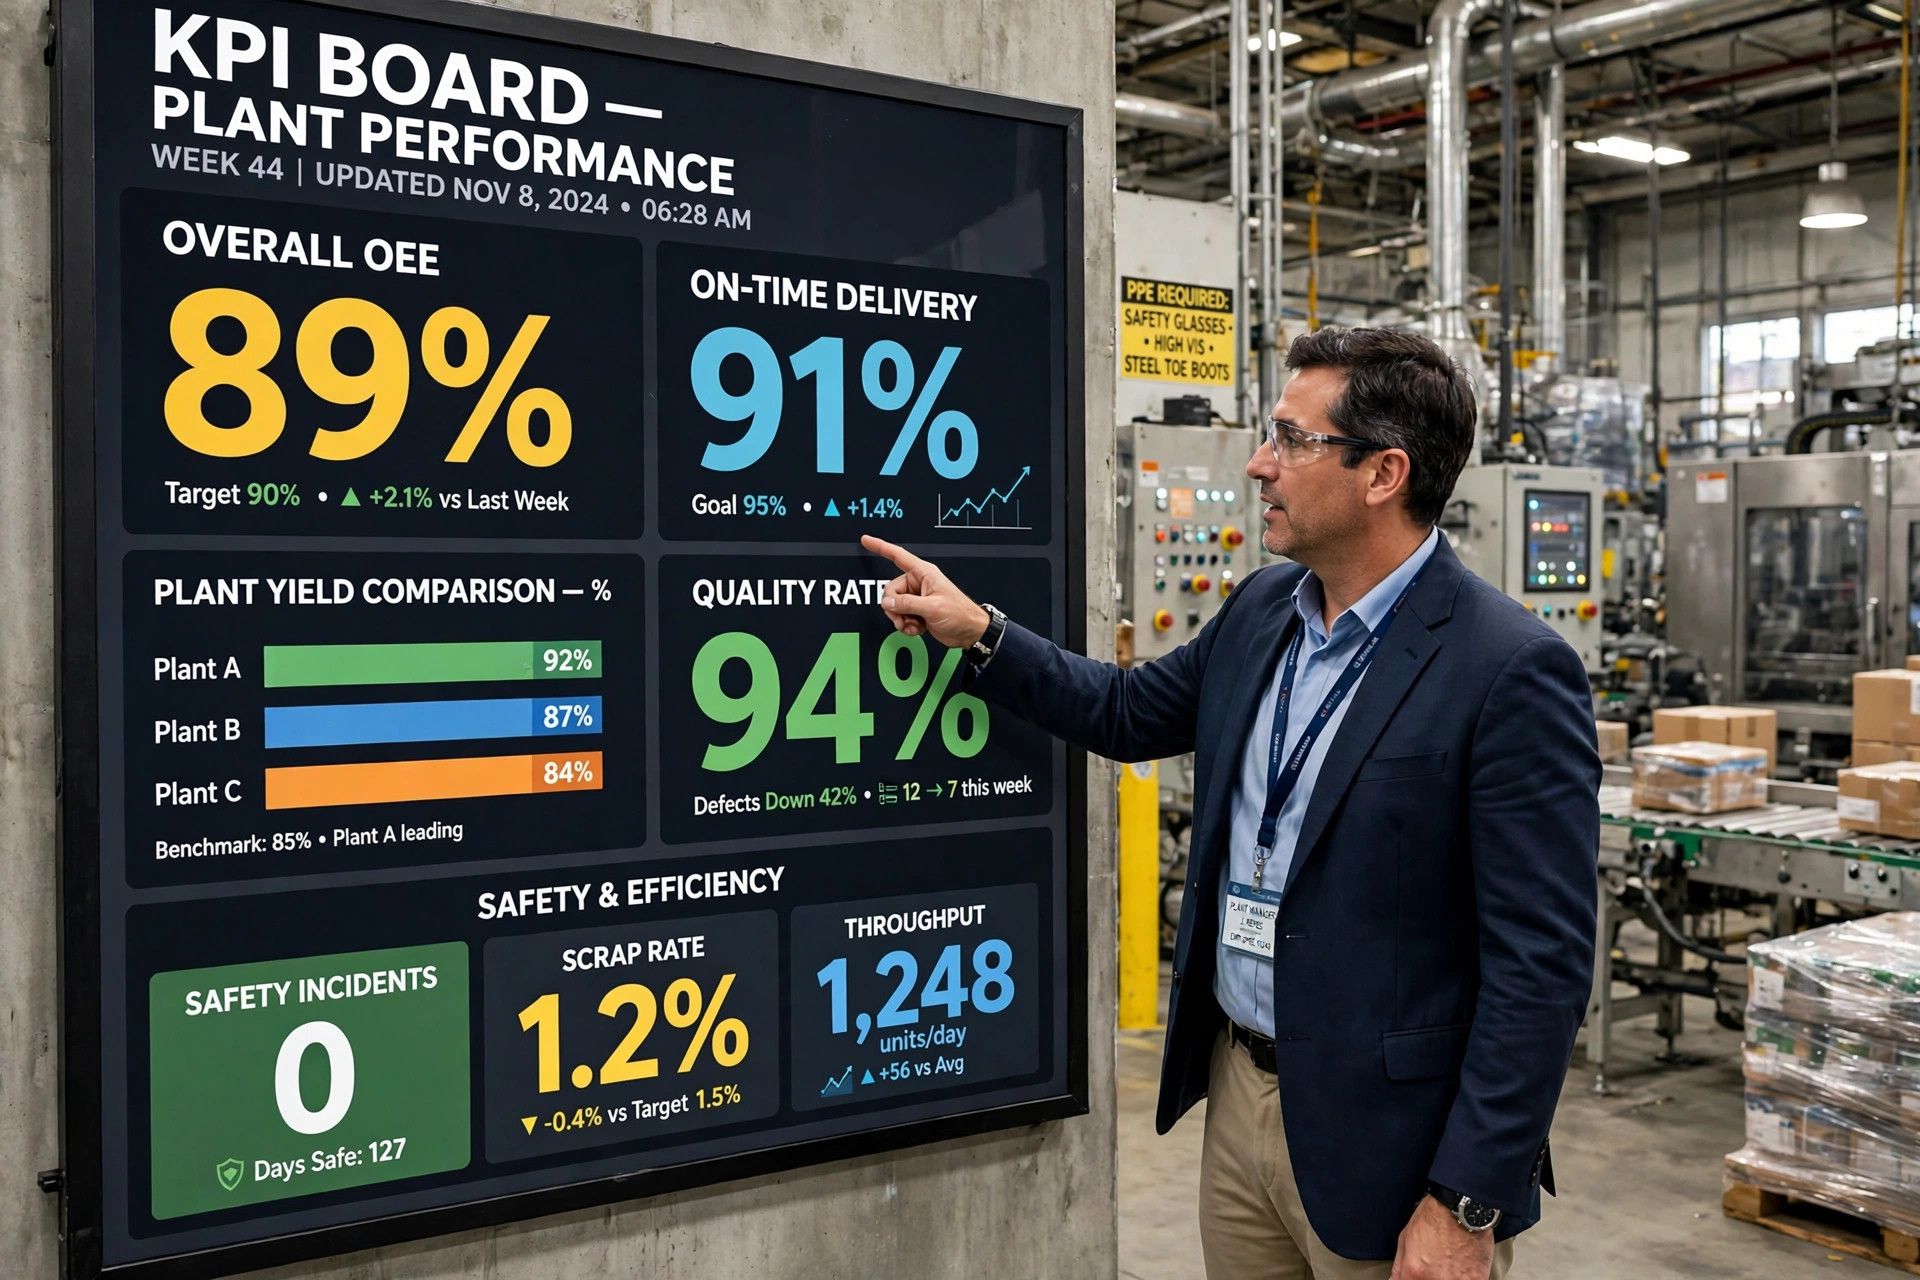
Overall equipment effectiveness is a widely used oee measurement for tracking how well production equipment turns planned time into good output. It helps you see how much of your production process is truly productive instead of lost to downtime, speed losses, or defects.
The method is closely tied to Total Productive Maintenance and to the work of Seiichi Nakajima. In practice, OEE matters because it converts day-to-day plant issues into a clear number and then breaks that number into causes your team can actually improve.
What Does Overall Equipment Effectiveness (OEE) Measure?
At its core, OEE measures how much planned production time becomes fully productive time. That means your asset is running, producing at the expected pace, and making acceptable parts. The oee calculation does not just give you a percentage. It shows how effectively a machine or line uses available production time.
In simple terms, OEE compares planned time to actual run time, output speed, and the share of good count versus total output. That is why the metric is useful for both one machine and an entire operation. Your oee score reflects downtime, slow cycles, small stops, and defect-related waste.
Current OEE benchmarks for different manufacturing industries vary, but broad ranges from the compiled data are still useful. Around 40% is low, 60% is typical, 80% is very good, and 85% or more is commonly treated as world class. Industry context matters, which is why plant type and process conditions must be part of any comparison.
The Three Pillars: Availability, Performance, and Quality
Every OEE result comes from three factors. Your availability score shows how much scheduled time the equipment was actually running. Your performance score shows whether it ran at the ideal pace. Your quality score shows how much output met spec without scrap or rework.
A useful oee calculation depends on all three, because a decent result in one area cannot fully offset weak results elsewhere. You might have strong quality but still lose heavily on breakdowns or slow cycles.
- Availability tracks downtime losses from stoppages, maintenance, and changeovers.
- Performance and quality expose speed losses, small stops, and defects.
What is considered a world-class OEE benchmark in 2025? Based on the compiled information, 85%+ is still the accepted world class mark. The classic breakdown tied to that target is about 90% availability, 95% performance, and 99% quality.
Why OEE Matters for US Manufacturing Plants
For US plants, OEE matters because it ties plant-floor events to business results. Equipment effectiveness affects throughput, labor use, schedule stability, and cost. If a line keeps stopping, running below rate, or producing defects, you feel it in missed output and rising expense.
OEE also supports continuous improvement because it gives managers and engineers a standard way to measure progress. You can compare similar assets, compare shifts, and track whether a maintenance or process change actually improved the manufacturing process.
Can OEE benchmarks help identify areas for improvement in production? Yes. That is one of their biggest strengths. Benchmarks tell you whether your current score is low or strong, while the availability, performance, and quality breakdown shows where to investigate first. That makes improvement work more focused and practical.
Setting the Stage: How OEE Is Calculated
Before you compare yourself to any benchmark, you need a clean oee calculation. OEE works by combining availability, performance, and quality into one measure of how much manufacturing time created good output.
Just as important, the formula helps you separate production losses into categories you can act on. With the right inputs, including total count and good output, you can tell whether your score is being pulled down by downtime, slow running, or defects. That sets up a more useful benchmark comparison.
Breaking Down the OEE Formula
The preferred oee formula is straightforward: OEE = Availability × Performance × Quality. Availability is run time divided by planned production time. Performance is ideal cycle time multiplied by total units, then divided by run time. Quality is good units divided by total units.
There is also a simplified form: good count multiplied by ideal cycle time, divided by planned production time. That version gives a quick view, but it does not explain why the result is high or low. For plant decisions, the three-factor method is much more useful.
How do you compare your OEE score to global industry standards? Start by calculating your score consistently with the preferred method. Then compare the overall result to broad ranges such as 40%, 60%, 80%, and 85%+, while also comparing your availability, performance, and quality results to your own plant baseline and operating conditions.
OEE Calculation Example Using Real Production Data
Here is a simple oee calculation using the production data in the compiled information. Planned production time is 300 minutes. Because of downtime, actual run time is 240 minutes. The machine produces 150 total units, of which 120 are good.
Metric
Formula
Example Input
Result
Availability
Run Time / Planned Production Time
240 / 300
80%
Performance
Ideal Cycle Time × Total Count / Run Time
1 × 150 / 240
62.5%
Quality
Good Count / Total Count
120 / 150
80%
OEE
Availability × Performance × Quality
0.80 × 0.625 × 0.80
40%
Is there a simple method to assess if your score is above or below industry average? Yes. Use broad benchmark bands first. In this example, a 40% oee score is low, well below the typical 60% level. Then look at the factor breakdown to see that performance is the biggest issue.
Common Pitfalls and How to Avoid Miscalculations
Many weak OEE decisions come from bad inputs, not bad equipment. If your oee data is incomplete or inconsistent, the score will point your team in the wrong direction. Manual tracking, missing downtime codes, and unclear definitions of planned time are common problems in the production process.
You also need to keep the calculation method consistent across lines and sites. If one team includes changeovers in planned time and another does not, the results are not comparable. That hurts benchmarking and can misdirect improvement efforts.
- Standardize data collection rules for run time, total count, and good count.
- Define planned production time clearly for every line and shift.
- Review whether operator-entered losses are complete and accurate.
When benchmarking, consider process type, equipment complexity, baseline performance, and data quality. Those factors matter just as much as the final percentage.

Interpreting OEE Scores: What Numbers Really Mean
An oee score only becomes useful when you know what the number means in daily plant terms. A result that looks strong on paper may still hide chronic speed losses or defect issues if you only focus on actual oee.
That is why managers should treat any oee target as a guide, not a trophy. Broadly, 60% is typical, 70% shows real control, and 85%+ is world class. The next sections explain what those levels usually mean for operations, maintenance, and production planning.
What a 60% OEE Score Indicates for Plant Operations
A 60% oee score is commonly described as typical. In practice, that means your plant is producing, but it is still giving up a meaningful share of available output to downtime, slower-than-ideal running, or defects. Many production lines operate in this range, especially when teams are early in formal OEE work.
For discrete manufacturing, 60% often points to frequent stops, changeover drag, or operator-driven variation. In process industries, it may show up as startup losses, availability issues, or recurring quality drift. The mix varies, but the message is the same: there is real room to improve.
What are the typical OEE benchmark targets for world-class manufacturing? The broad benchmark ladder in the source material is 40% low, 60% typical, and 85% world class. So 60% is not failure. It is a solid baseline that usually signals the need for structured improvement.
Practical Impacts of Reaching 70% OEE
A 70% result usually means your plant is moving beyond basic firefighting. You still have losses, but your production equipment is likely more stable, better understood, and managed with more discipline. For many teams, this is where OEE starts to feel less theoretical and more operationally useful.
In practical terms, 70% often reflects gains from preventive maintenance, improved changeovers, better standard work, and fewer recurring stops. It is also a meaningful step above average oee levels described in many real-world studies, where plants often land closer to the mid-50s to low-60s.
Can OEE benchmarks help identify areas for improvement in production at this stage? Yes. Once you reach 70%, benchmarking becomes even more valuable because it helps you avoid complacency. It shows whether your next gains should come from Total Productive Maintenance, speed improvement, or tighter quality control.
What Achieving 85%+ OEE Means—Is It World-Class?
An 85%+ score is widely treated as world class. That label comes from long-standing OEE practice and the benchmark framework tied to Seiichi Nakajima. In plain terms, it means your manufacturing equipment is available most of the time, runs near its ideal pace, and produces very few defects.
Still, it is worth staying practical. A world class result does not mean your production process is perfect. A true 100% score would require no downtime, no speed losses, and no quality loss at all, which is not realistic in normal operations.
So what is considered a world-class OEE benchmark in 2025? The same answer still holds from the compiled information: 85% or better. If your plant is there consistently, you are operating at a very high level. If you are below it, your focus should stay on steady, measurable improvement.
OEE Benchmark Ranges by Industry Sector
Industry benchmarks matter because not all plants face the same operating conditions. A high-mix line, a continuous process, and a tightly regulated operation can all post different OEE patterns even when they are well run.
That means oee benchmarks should be used as ranges, not as rigid scorecards. The compiled information gives broad levels that apply across sectors, while the production process, changeover profile, and typical loss pattern help explain why one industry’s “good” score may look different from another’s.
Automotive Manufacturing OEE Benchmarks
In automotive manufacturing, OEE is especially useful because lines are fast, assets are interconnected, and small disruptions can spread quickly. The broad oee benchmarks from the compiled information still apply: around 60% is typical, 80% is very good, and 85%+ is world class.
What shifts the score in automotive is often the mix of the big losses. Breakdown losses, setup and adjustment losses, idling, and minor stoppages can heavily affect results. Because cycle expectations are tight, performance losses can be especially costly even when quality remains strong.
So what are the current OEE benchmarks for this sector? Use the broad ranges first, then compare against your own plant baseline. An automotive plant near 70% is usually showing meaningful control and steady improvement efforts. A plant below 60% likely has clear opportunities in downtime, speed, or changeover performance.
Food and Beverage Industry OEE Standards
For food and beverage operations, the same benchmark bands provide a useful starting point. A result around 60% is typical, while 80% is very strong and 85%+ is world class. Plants in this sector often watch total effective equipment performance closely because product flow and uptime directly affect yield.
Availability losses can be a major factor here due to cleaning, changeovers, and unplanned stoppages. Quality rate also matters because defects, rework, or startup waste can quickly erode the final score even when throughput looks healthy during a shift.
Where can you find OEE benchmark data for your specific industry sector? Start with your own historical OEE, compare lines doing similar work, and review industry reports or internal network data if available. You can also use the OEE overview at
https://www.empoweredautomation.com/oee to align your definitions before benchmarking.
Pharmaceutical, Aerospace, and Other Industry Averages
In pharmaceutical manufacturing, aerospace, medical devices, and chemical processes, benchmark interpretation needs extra care. These environments often involve strict quality standards, validation steps, longer setup activity, or complex process conditions. Because of that, the broad OEE ranges should be treated as reference points, not absolute judgments.
The compiled information does not provide separate numeric averages for each of these sectors. What it does show is that real-world plants often fall below the 85% ideal, with studies citing practical ranges above 50% and acceptable performance between 60% and 75% in many industries.
So what are the current OEE benchmarks for different manufacturing industries in these sectors? Use the common framework: 40% low, 60% typical, 80% very good, 85%+ world class. Then anchor your comparison to plant type, regulatory burden, and the specific losses affecting your operation.
Regional and Global OEE Benchmark Comparisons
Regional comparisons can be useful, but they need context. Oee benchmarks shift by country and region because plants do not share the same equipment age, labor practices, maintenance maturity, or operating mix.
Global standards still give you a helpful frame, especially the familiar 60% typical and 85% world class markers. But if you want a fair comparison, you need to look past geography alone. Plant design, process complexity, and data quality usually explain as much as the country label does.
OEE Benchmark Variations Across the United States
Within US manufacturing, OEE variation often has less to do with state lines and more to do with plant maturity, asset condition, product mix, and leadership discipline. Two facilities in the same company can produce very different results if one has cleaner data, better standard work, and stronger maintenance execution.
Regional differences can still show up through workforce availability, installed equipment age, local supplier reliability, and operational culture. Plants with better performance management practices usually sustain gains longer because they review losses routinely and act on them quickly.
How do OEE benchmarks vary across countries? The compiled information does not give country-by-country percentages, but it does explain why differences happen. You should assume that country comparisons are only meaningful when the plants share similar process type, equipment profile, and measurement method. That same rule applies across the United States.
Comparing US OEE Benchmarks to Global Standards
For most manufacturers, the best way to compare US results to global standards is to use common OEE ranges rather than chase one exact number. OEE is a key performance indicator, but it only works as a fair benchmark when the calculation method and plant conditions are consistent.
Benchmark Level
OEE Range
Practical Meaning
Low
Around 40%
Major losses are limiting output
Typical
Around 60%
Common starting point with clear gaps
Strong
Around 70% to 80%
Good control and visible improvement
World Class
85%+
High stability across availability, performance, and quality
How do you compare your OEE score to global industry standards? First, calculate OEE the same way every time. Next, place your result in one of these benchmark bands. Then compare the three components behind the score, because a plant with the same total OEE can have very different operational issues.
Factors Affecting OEE Benchmark Differences by Country or Region
Benchmark gaps between regions are usually driven by operating realities, not by geography alone. If one site has older assets, less automation, or weaker data discipline, it may post a lower score even when the team is working hard. The reverse is also true.
Your cycle time assumptions also matter. If ideal rates are outdated or unrealistic, performance will be distorted. The same problem appears when sites classify downtime differently. Those inconsistencies can hide production losses or make one plant look better than another unfairly.
- Equipment failures, setup practices, and maintenance maturity shape availability.
- Ideal rate assumptions and small-stop tracking shape performance.
- Scrap rules and rework treatment shape quality.
When benchmarking, focus on apples-to-apples comparisons. The most useful view combines regional context with plant-specific conditions and recent improvement efforts.
Using OEE Benchmarks to Drive Continuous Improvement
The best use of oee benchmarks is not ranking plants for bragging rights. It is helping your team decide where to act next. When you compare scores the right way, you can see whether losses come from downtime, slow running, or poor quality.
That is why OEE fits so well with continuous improvement. It gives structure to improvement efforts, helps teams set realistic goals, and shows whether changes actually worked. The next sections cover how to benchmark in a way that leads to practical action on the floor.
Key Factors for Meaningful OEE Benchmarking
Meaningful benchmarking starts with clean definitions and repeatable data. If your oee metrics are not built the same way across shifts, lines, or sites, your comparisons will not hold up. Good data collection is the first requirement, not the final step.
You also need to connect OEE to the rest of your maintenance kpis. A falling score may relate to MTTR, frequent failures, poor changeover control, or weak operator response to small stops. Composable OEE dashboards can help organize that view, but only if the source data is trustworthy.
- Use one standard definition for planned time, run time, and good count.
- Compare like-for-like assets, products, and process conditions.
- Review OEE with maintenance, operations, and engineering together.
What factors should you consider when benchmarking your OEE? Focus on process type, equipment age, product mix, staffing, and the consistency of your measurement rules.
Simple Methods to Compare Your Plant’s OEE to Industry Averages
You do not need a complex model to make a first comparison. Start with the preferred oee formula and calculate one reliable baseline for each line or asset group. Then place that result against broad oee benchmarks: about 40% low, 60% typical, 80% very good, and 85%+ world class.
Next, compare each result to the right peer group. A packaging line, batch process, and high-mix machining cell should not share the same oee target without adjustment. Your process type shapes what “good” looks like in practice.
- First compare to your own historical baseline.
- Then compare to broad benchmark bands and similar assets.
This is the simplest way to tell whether your score is above or below industry average. It is fast, practical, and accurate enough to guide where deeper analysis should start.
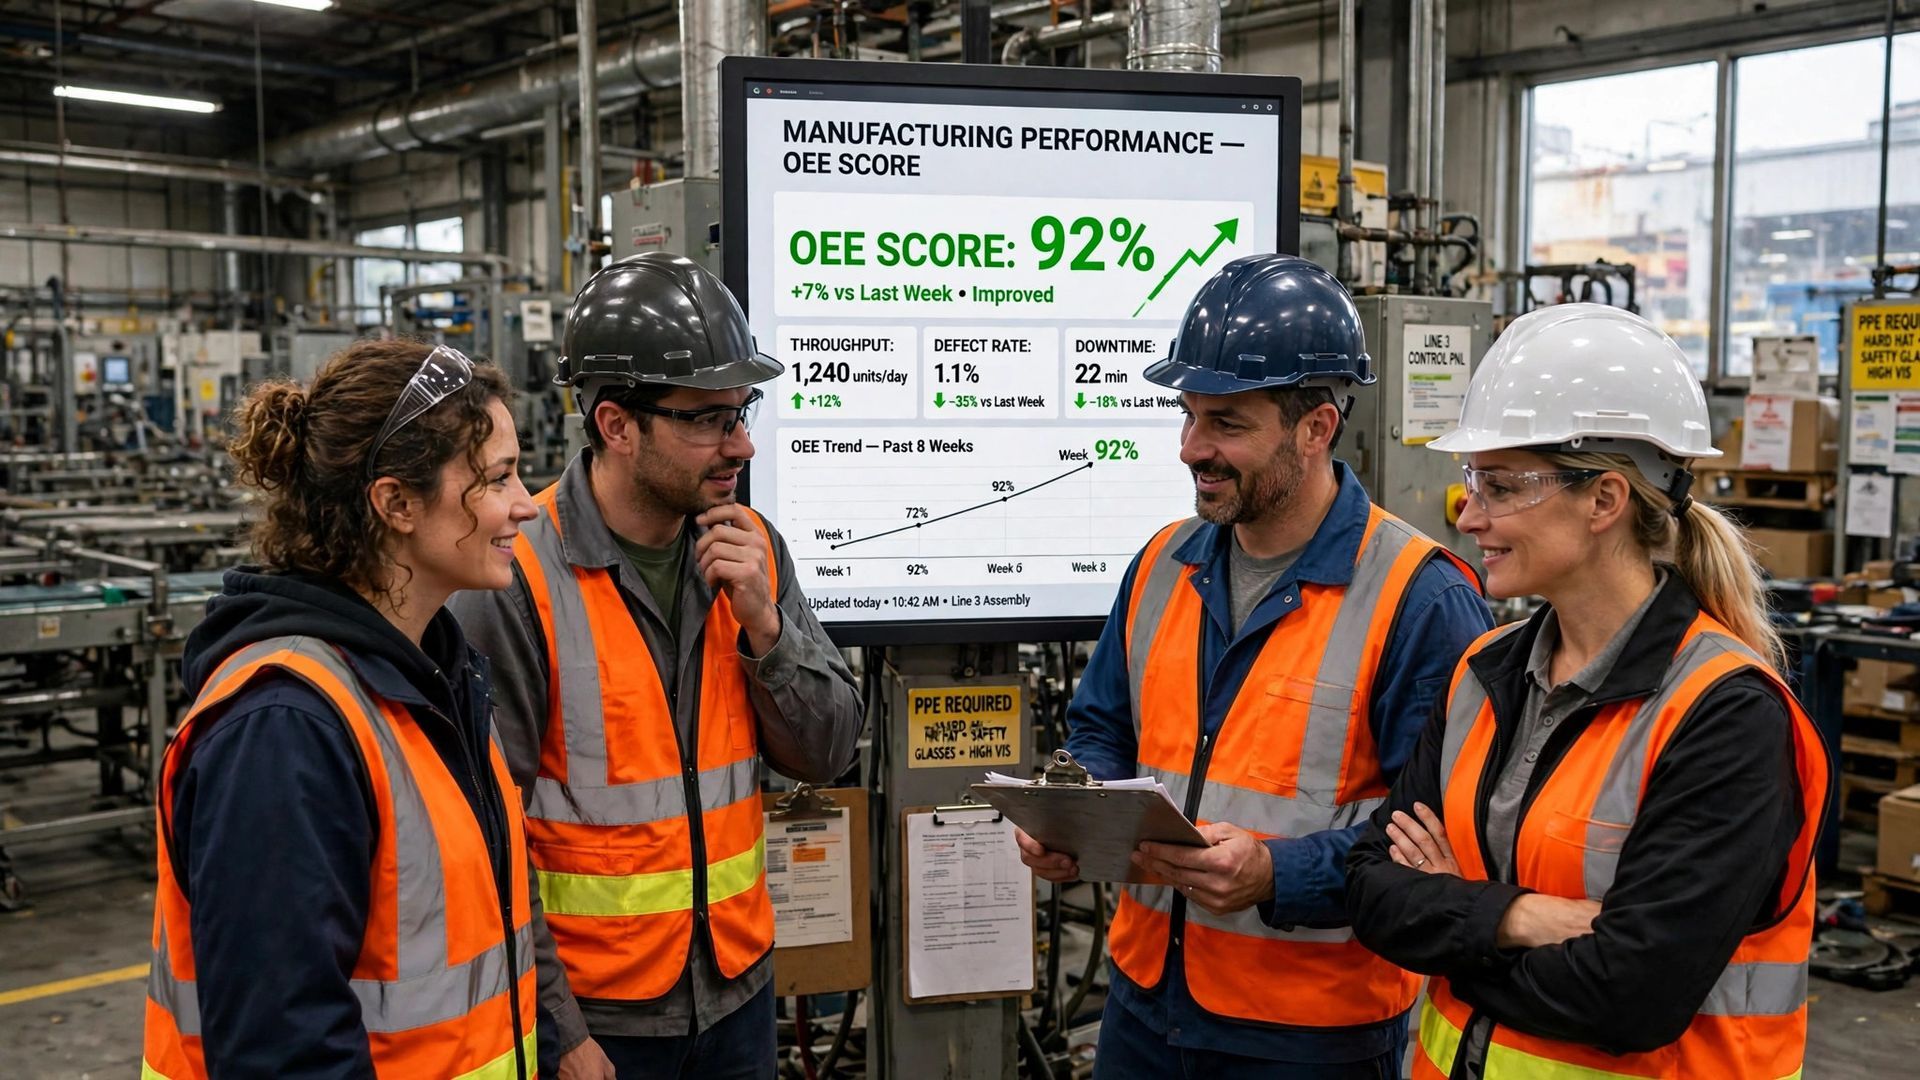
How OEE Insights Reveal Production Improvement Opportunities
A single OEE number tells you how big the gap is. The factor breakdown tells you where the gap lives. If availability is weak, look at downtime and changeovers. If performance is weak, investigate minor stoppages, slow cycles, and operator interventions. If quality is weak, start with defective products and rework.
This is where OEE becomes practical for plant teams. You can review total count, good output, and run loss patterns by shift, product, or asset. That makes it easier to spot recurring issues instead of treating every bad day as a separate event.
Can OEE benchmarks help identify areas for improvement in production? Absolutely. Benchmarks show whether the gap is material. The OEE details show what to fix. That combination is what turns measurement into action.
Conclusion
In conclusion, understanding and utilizing OEE benchmarks can significantly enhance your manufacturing processes. By knowing what constitutes a good OEE score—whether it’s 60%, 70%, or an impressive 85%+—you can make informed decisions that drive operational efficiency and productivity. Each score reflects different insights about your plant's operations, from identifying areas of improvement to achieving world-class performance. Make sure to leverage industry-specific benchmarks and regional comparisons to gain a comprehensive view of where your plant stands. For more detailed information and resources on OEE, check out our OEE pillar page at https://www.empoweredautomation.com/oee. By embracing these insights, you can foster a culture of continuous improvement and keep your manufacturing operations at the forefront of the industry.
Frequently Asked Questions
Where can I find the latest OEE benchmark data for my industry?
Start with your own oee data, because internal history is often the most useful benchmark. Then review industry benchmarks from trade groups, vendors, or internal network reports. Before comparing numbers, make sure your data collection rules match the source. Otherwise, the report may not give you a fair comparison.
How often are OEE benchmarks reviewed or updated?
Oee benchmarks should be reviewed regularly as fresh production data becomes available. In practice, many plants update internal comparisons monthly or quarterly. The right update frequency depends on output volume and change rate. For continuous improvement, your own oee score trend matters just as much as any outside benchmark.
Can OEE benchmarking help optimize maintenance and downtime management?
Yes. Oee benchmarking helps you connect downtime management to results you can measure. When availability drops, teams can tie the issue to maintenance kpis and target root causes. That supports Total Productive Maintenance by showing whether oee metrics are improving after changes in preventive work, repair response, or operating discipline.
You might also like