OEE Dashboards by Audience: What Operators, Supervisors, and Managers Need to See
Key Highlights
- Operators need oee dashboards that show real time machine performance, cycle time, downtime events, and clear alerts. To monitor multiple production sites, set up oee dashboards with site-specific data streams, ensuring each dashboard displays performance metrics for individual production lines and machines at each location. Use centralized views that allow supervisors and operators to toggle between different sites, and include comparisons of shift trends and downtime events to identify gaps across locations. Supervisors need shift trends, aggregated metrics, and views that compare team performance across production lines. Integrating multiple production sites into your oee dashboards ensures seamless visibility into both site-specific and enterprise-wide metrics, making it easy to track machine performance, cycle time, and downtime events in real time.
- Supervisors need shift trends, aggregated metrics, and views that compare team performance across production lines.
- Managers need plant-level visibility, multi-site summaries, and oee reports that support executive reporting.
- Good dashboard design depends on reliable data from machines, sensors, barcode scans, and limited manual data entry.
- Role-based views improve production visibility, speed response, and support continuous improvement across the shop floor.
Introduction
If you want overall equipment effectiveness to drive action, your team cannot all look at the same screen and hope for the best. OEE dashboards work best when they match the job in front of each person. Operators need instant cues. Supervisors need shift-level patterns. Managers need broader production data and trends across lines or sites. This article breaks down what each audience needs to see, so your dashboard supports faster decisions instead of adding another report.
Understanding OEE Dashboards in Manufacturing
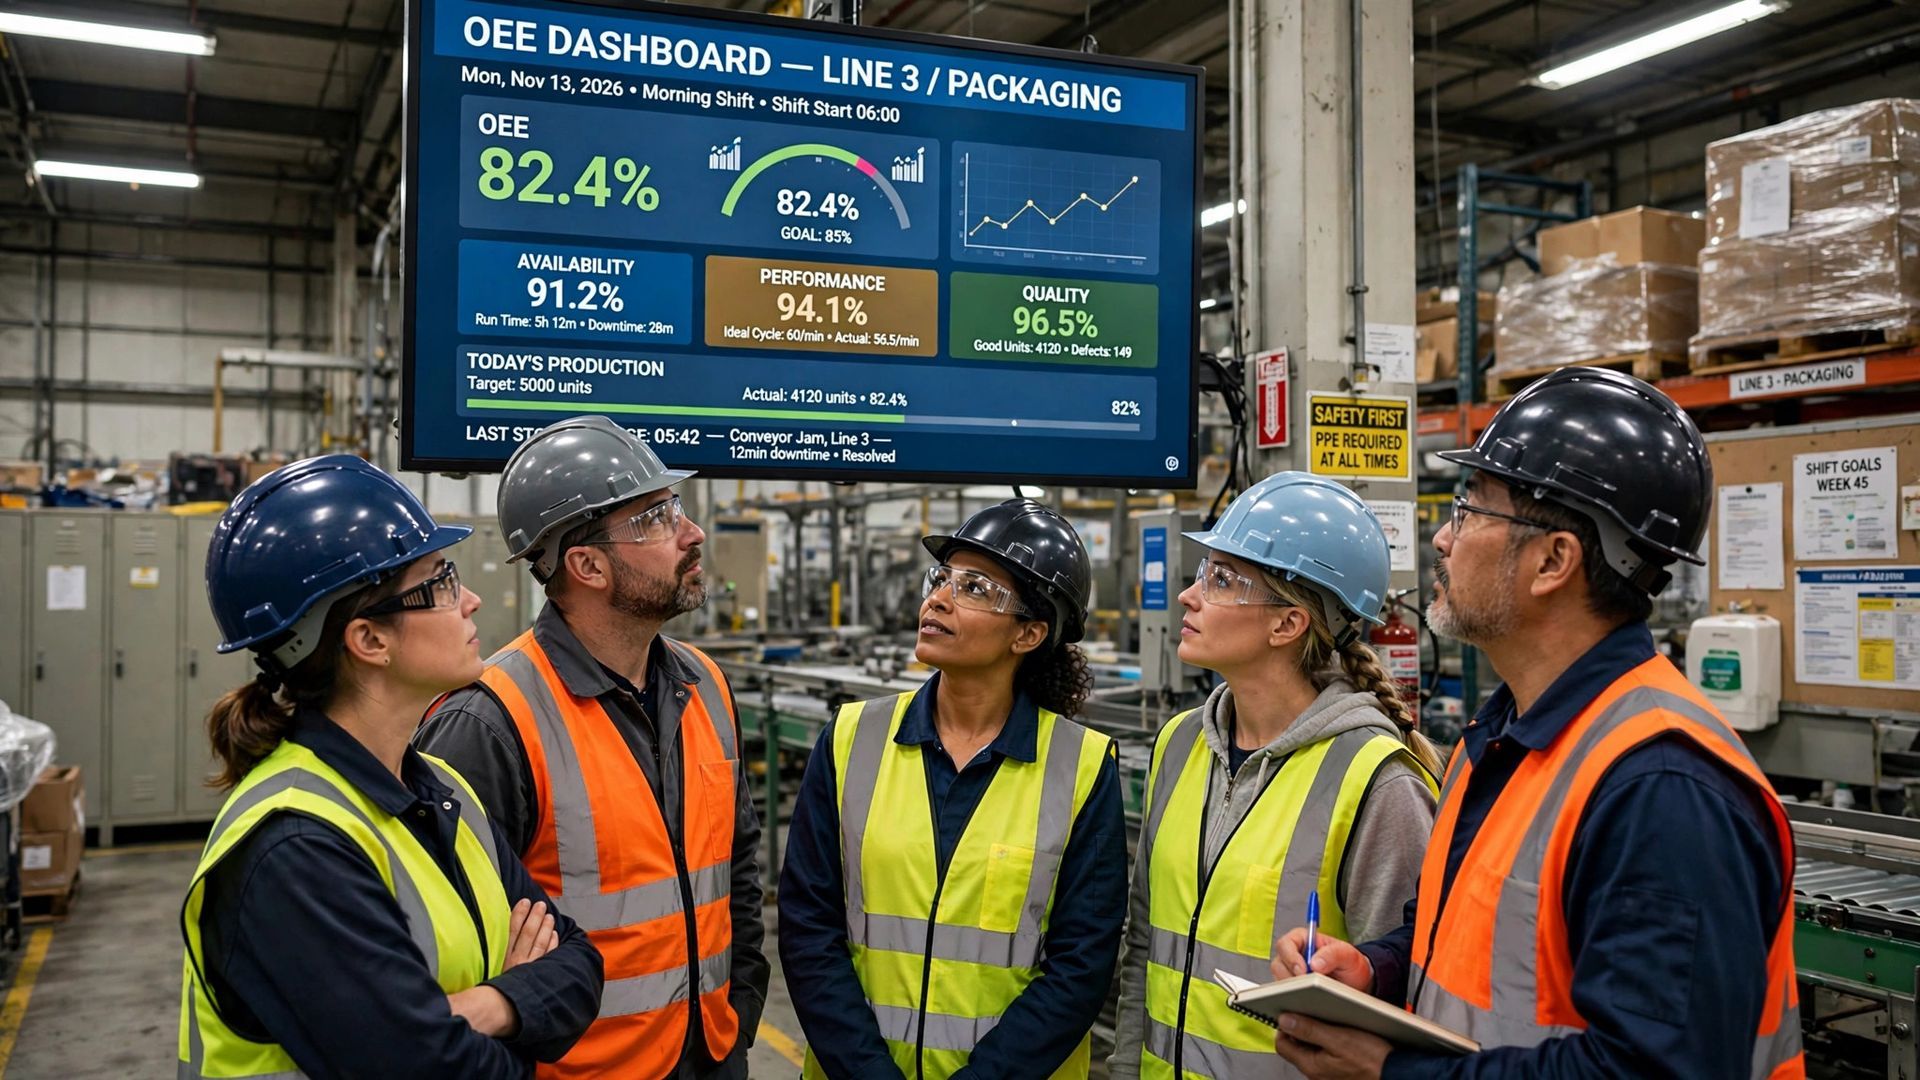
At the core, oee dashboards are production visibility tools. They show equipment effectiveness in a visual format that is easy to read at a glance. Instead of waiting until the end of a shift, you can see how machines are performing during scheduled production time.
Just as important, they simplify data collection. Good systems pull oee data from machines, sensors, and operator inputs, then turn it into practical views. That makes it easier to spot losses, compare results, and decide where to focus next. The sections below explain how that looks by role.
An oee dashboard is a production visibility tool that shows how equipment is running against its planned capacity. In simple terms, it turns raw production data into a screen your team can read quickly. That matters because most people on the floor do not have time to sort through spreadsheets.
What makes it useful is real time data visualization. Instead of reviewing numbers after the fact, you can see machine state, downtime, output, and related losses while work is happening. That gives operators, supervisors, and engineers a living window into current performance.
It also brings operational data into context. A dashboard can display one machine, one department, or the whole shop. When you put OEE next to downtime reasons, first-pass yield, or shift progress, you get a clearer picture of what is helping or hurting production.
Key Metrics Included in an Effective OEE Dashboard
A useful dashboard starts with the core oee calculation: Availability × Performance × Quality. That keeps the whole plant using the same logic when discussing losses. Still, the score alone is not enough. You need supporting oee metrics that explain why the number moved.
For day-to-day use, the best dashboards show the factors behind production efficiency. That means pairing machine status with timing, output, and defect information. When those measures are visible together, teams can act faster and avoid guessing.
Key metrics often include:
- Availability, performance, and quality metrics
- Actual cycle time versus ideal cycle time
- Downtime events, including unplanned stops and minor stops
- Good parts, scrap, and first-pass yield
These measures help operators react, help supervisors compare shifts, and help managers see where losses are building across the operation.
Common Data Sources Integrating into OEE Dashboards
Strong dashboards depend on solid data sources. If your numbers are late or inconsistent, the screen becomes just another report. The most useful setups connect directly to machines, sensors, and PLCs so equipment data feeds the dashboard automatically.
In many plants, not everything comes from automation. Some oee data still comes from operator inputs, especially for downtime reasons, tool status, or changeover times. Barcode scans can also add context by tying production runs to orders, parts, or lots.
Here is a simple view of common inputs:
Data Source
What It Adds to the Dashboard
Machine or PLC signals
Run state, stop state, cycle counts, and live data streams
Sensors and connected devices
Equipment data for status, speed, and performance changes
Manual data entry
Downtime reasons, quality issues, and changeover notes
Barcode scans
Part, order, or lot tracking tied to production events
OEE Dashboard Features by Audience Overview
Not everyone uses oee dashboards for the same reason. An operator needs immediate feedback to keep one asset running. A supervisor needs a broader view of shift execution. A manager needs a summary of plant production performance and longer-term trends.
That is why audience needs should shape the screen design. One dashboard platform can support different views, but each view should focus on the decisions that role must make. The next sections break down the practical differences for operators, supervisors, and managers.
Why Tailoring Dashboards Increases Production Visibility
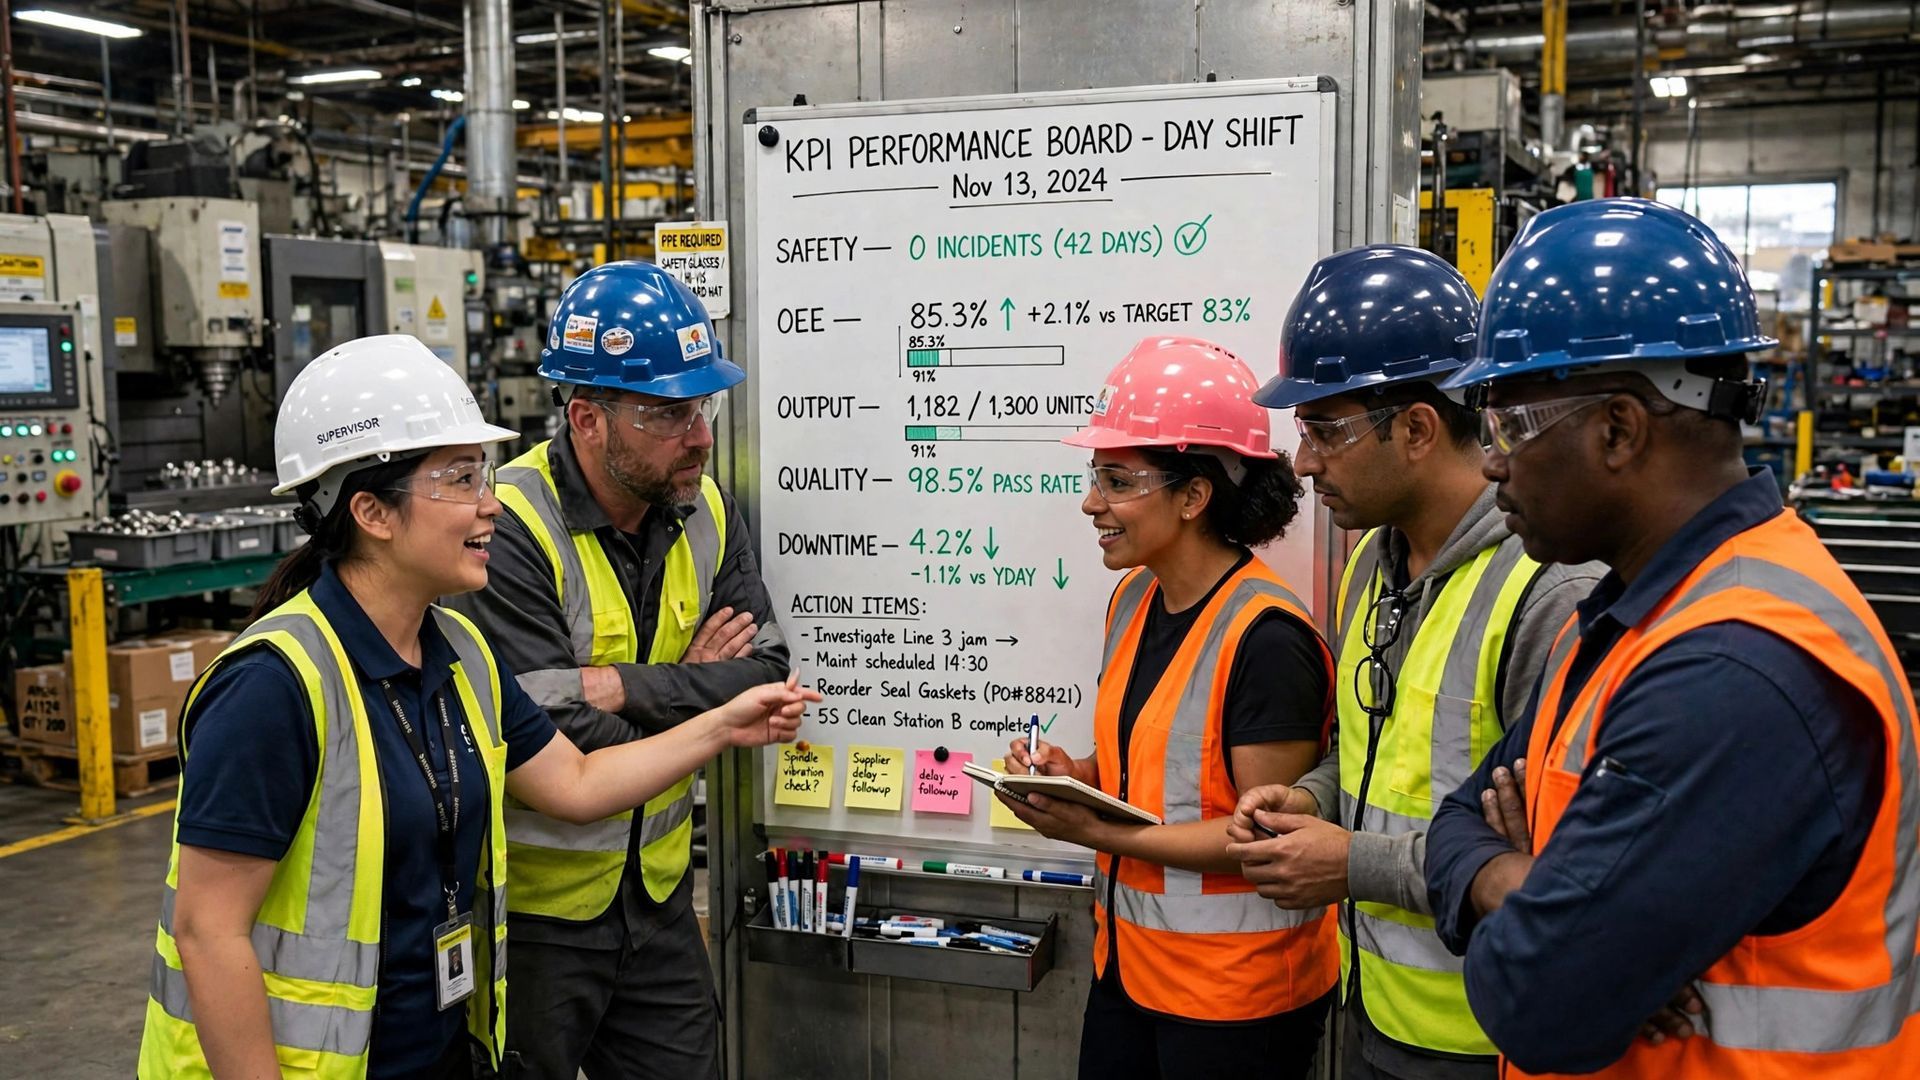
A single shared screen sounds efficient, but it often creates noise. On the shop floor, people need different levels of detail. Operators care about what needs attention right now. Supervisors need to compare lines and shifts. Managers need summary views that guide decisions across the plant.
When oee dashboards are tailored by role, production visibility improves because each person sees the right level of action. That shortens the path from data to response. Instead of hunting through menus, teams can focus on the issue in front of them.
This also helps continuous improvement. Operators can catch drift early. Supervisors can spot recurring losses between crews. Managers can see where trends justify a larger effort. The result is not just better reporting. It is better follow-through across the whole operation.
Main Features to Look for in OEE Dashboard Solutions
If you are choosing oee software, start with one question: will this help people act faster? A good dashboard should make losses visible early, not bury them under extra clicks. It also needs reliable data, because teams stop trusting the system when numbers do not match the line.
Best practice is to look for flexible, role-based views and built-in math. That keeps the whole team aligned on the same OEE logic while letting each group see what matters most. Ease of setup matters too, especially when engineering teams need to move quickly.
Look for features such as:
- Real-time machine data from connected equipment
- Automatic OEE calculation using one consistent formula
- Alerts for speed loss, scrap, or downtime changes
- Links to MES or ERP for production context
Those basics create a dashboard that supports action, not just display.
Operator View – Essential Metrics and Visualization Tools
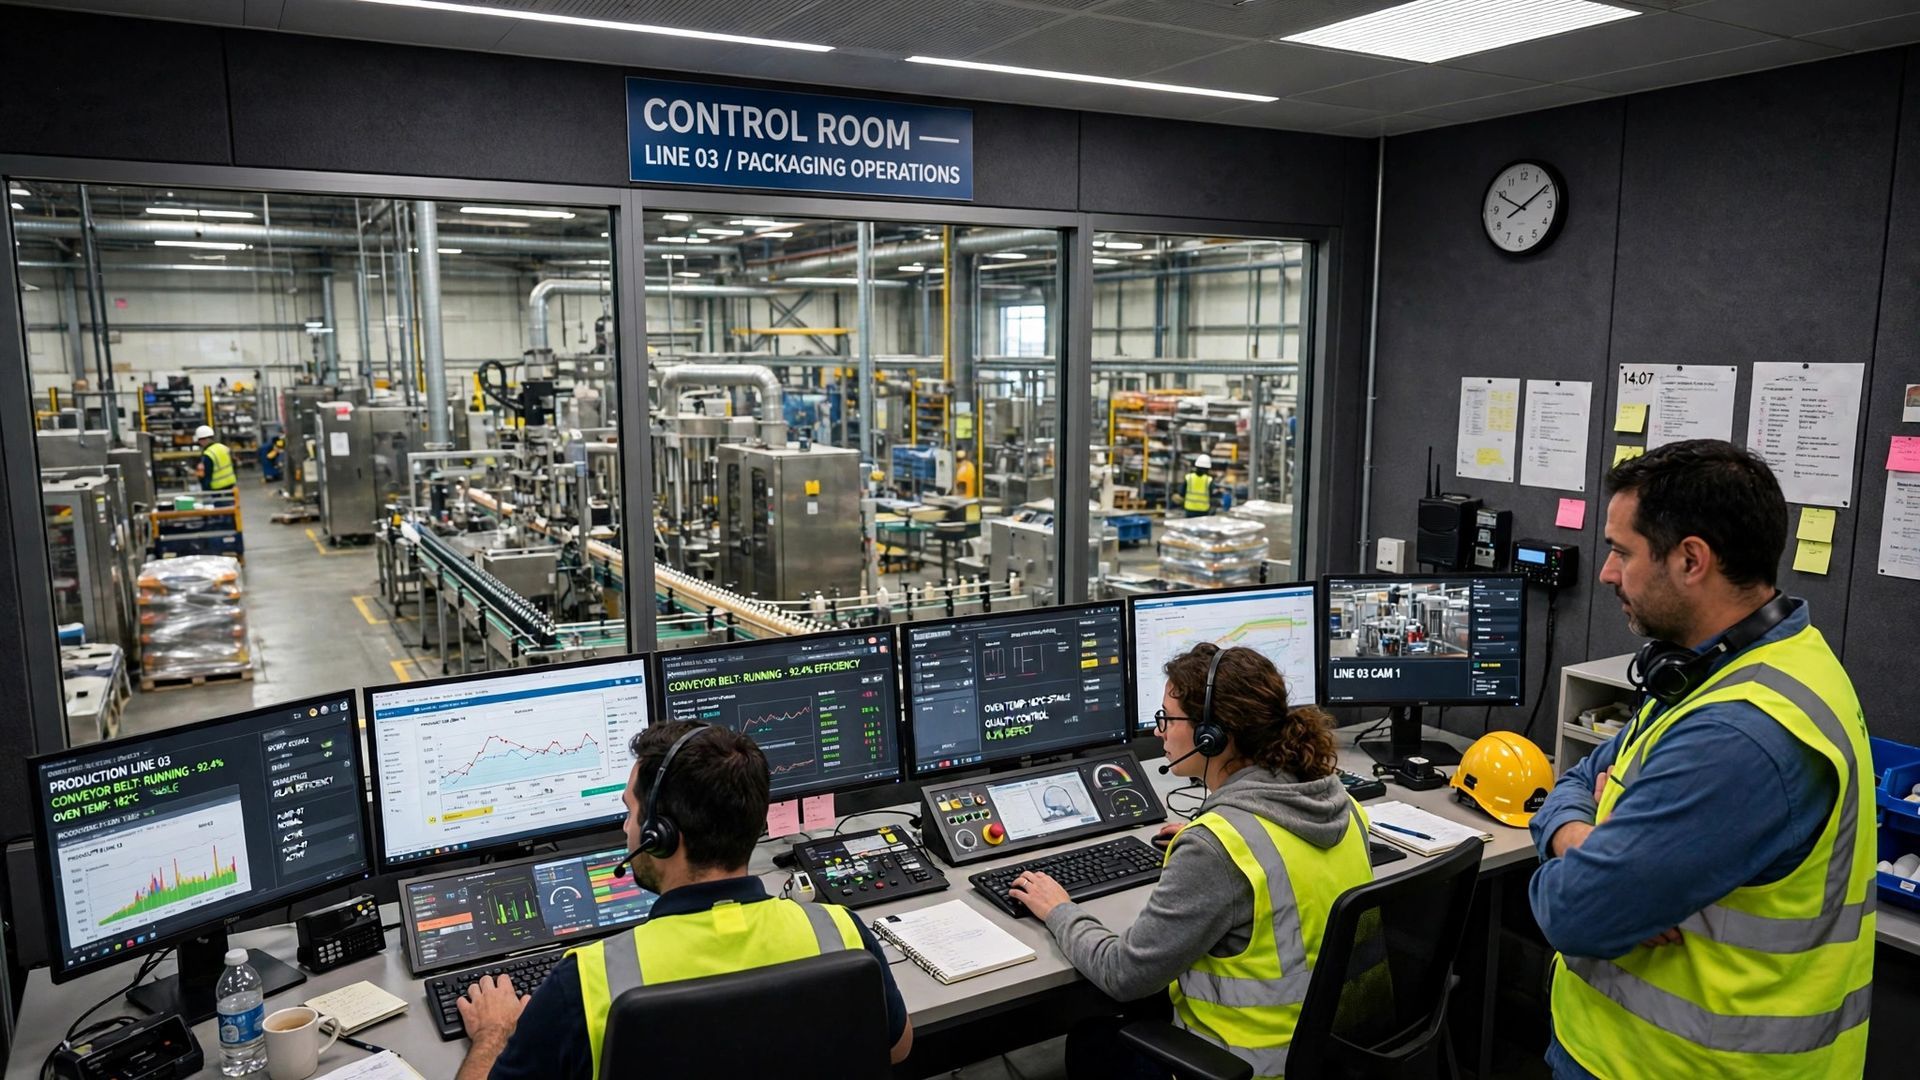
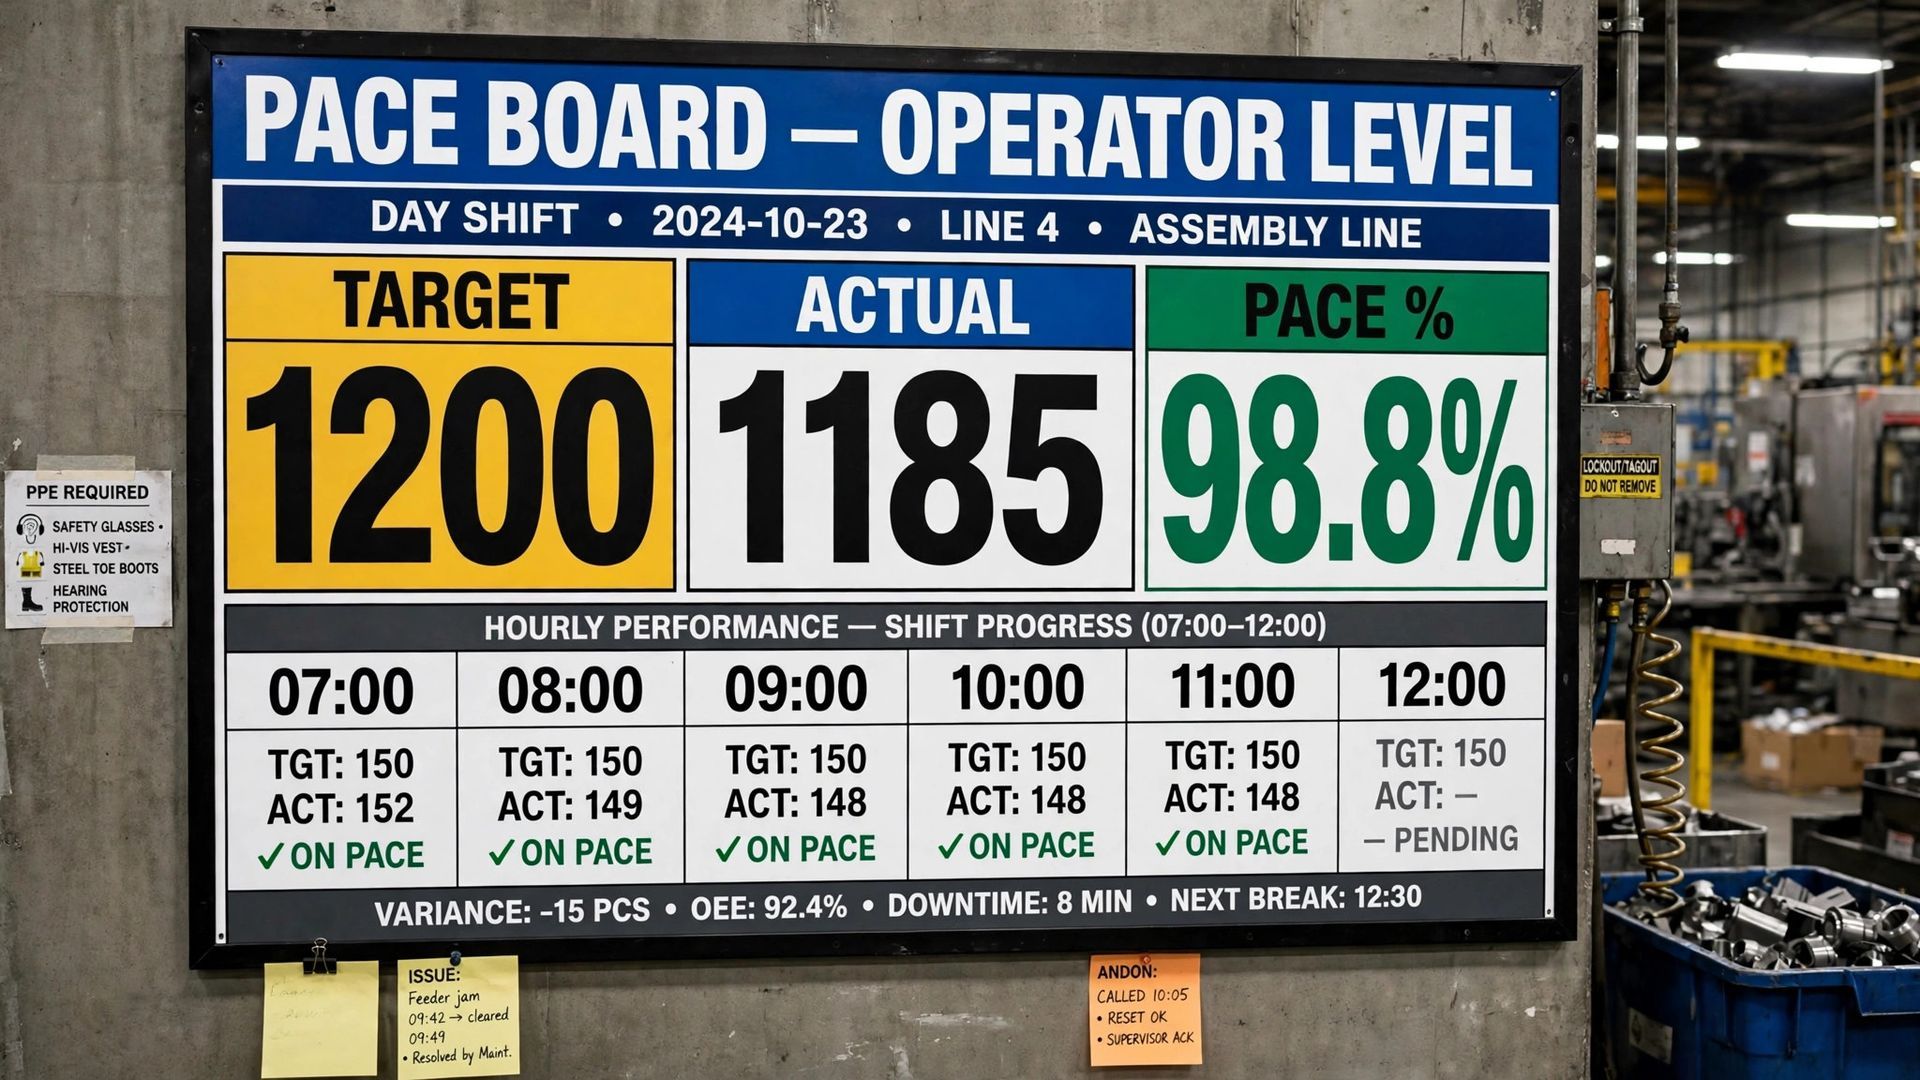
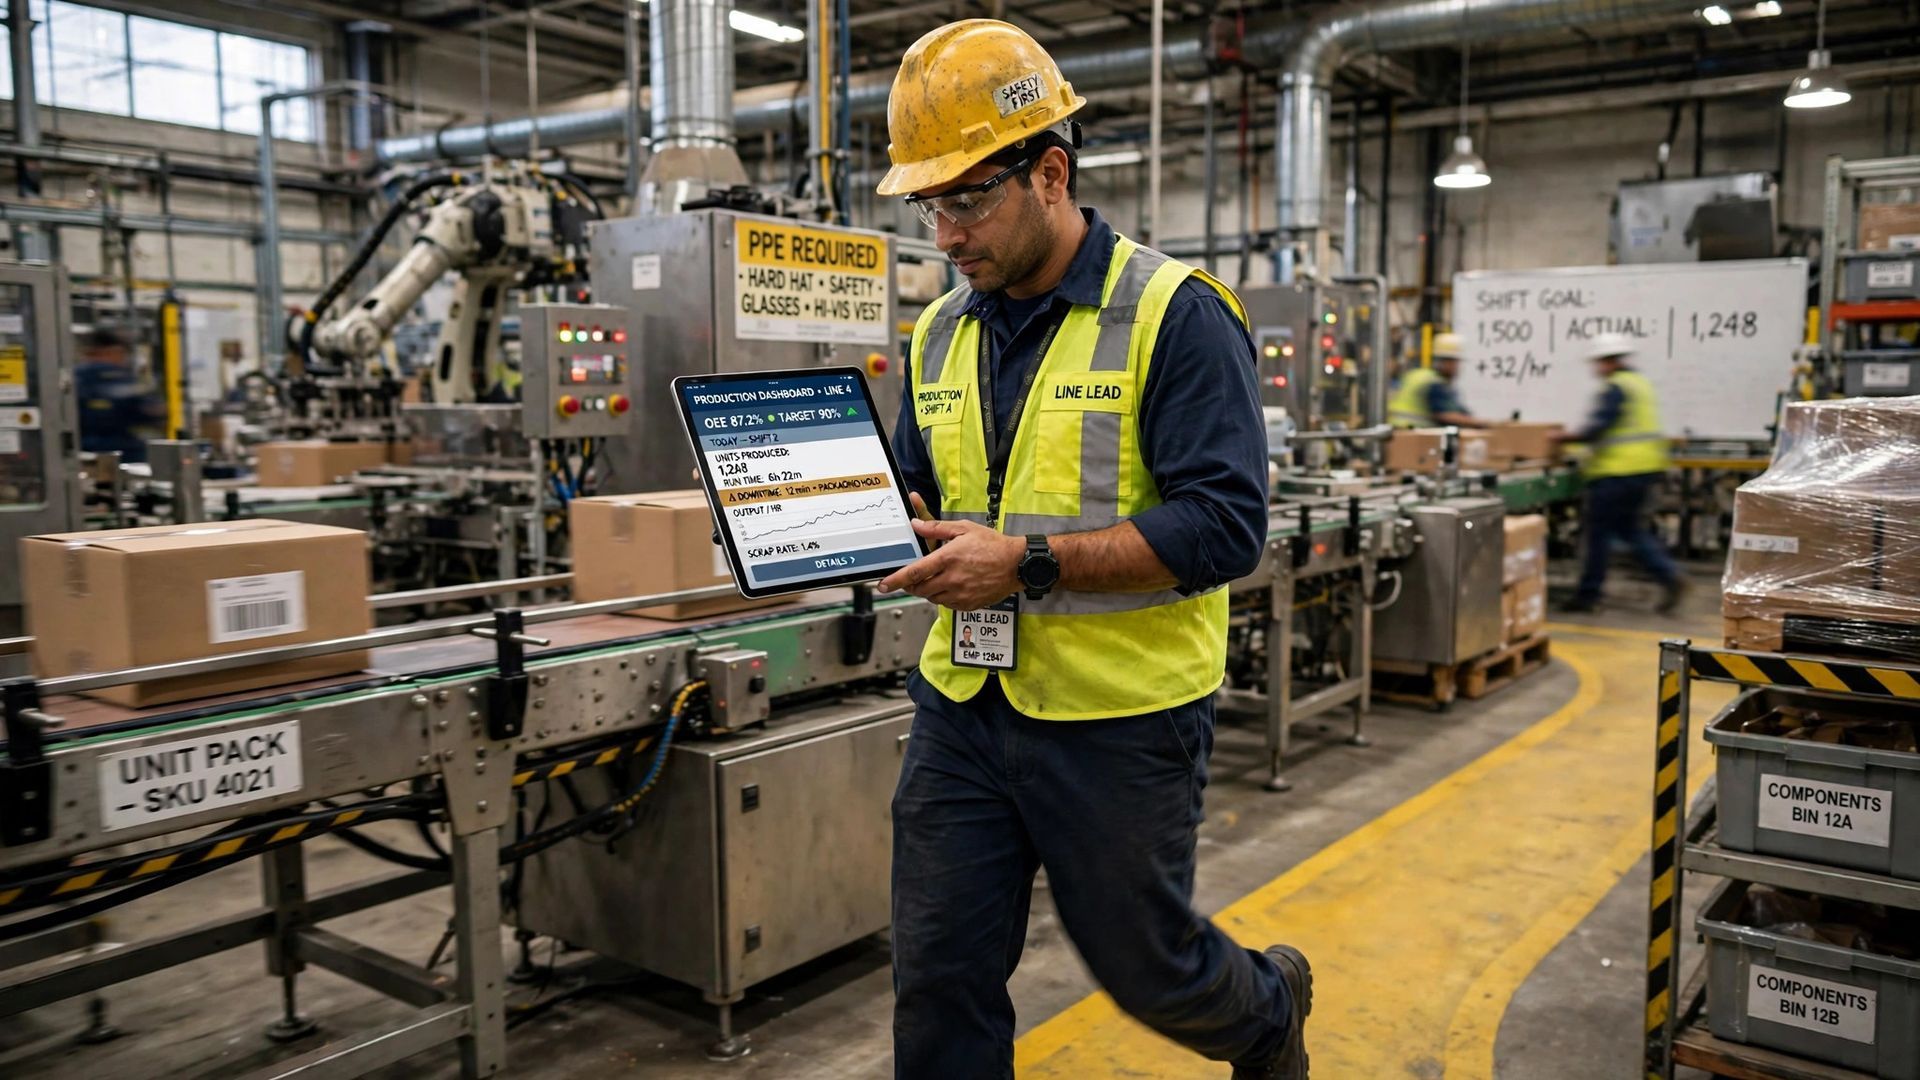
For operators, the screen must answer one question fast: what needs attention right now? Real time views of machine performance help them react before a small issue becomes lost output. That means less waiting for reports and fewer surprises at the end of the shift.
The best operator-focused oee dashboards stay simple. They highlight current status, pace, and downtime events on the specific machine or cell the operator controls. From there, useful charts and alerts make the next action obvious.
Real-Time Equipment Performance Tracking for Operators
Operators need a machine level view, not a plant summary. When a line is running, the dashboard should show real time status so the operator can tell if the asset is producing, idling, stopped, or falling behind target pace. That is how oee data becomes useful on the floor.
A strong operator screen should make run time easy to understand. If cycle speed slips, if a stop repeats, or if scrap begins to rise, the operator should see it without waiting for someone else to pull a report. That supports faster recovery on busy production lines.
Think of it as a control panel for daily work. Instead of checking paper logs or asking for updates, the operator sees current output, current state, and current loss signals in one place. That direct view helps protect availability, performance, and quality during the shift.
Typical Charts and Alerts Operators Need
Operators do not need complicated analytics screens. They need charts and alerts that support quick decisions during the run. The right visuals make production data easy to scan so problems stand out right away instead of showing up at the end of the shift.
Simple visuals work best because they match the pace of the shop floor. A gauge, timeline, or status panel can say more in two seconds than a detailed table. Alerts should be clear enough to prompt action without creating alarm fatigue.
Common operator tools include:
- Status tiles showing running, stopped, or waiting states
- Trend charts for output or cycle pace during the shift
- Alerts for downtime, speed loss, or rising defects
- Tool status or change prompts tied to the current job
These views help the operator stay focused on the machine, not on interpreting the screen.
Quick Actions on Downtime and Defects
The real value of an operator dashboard is quick response. When downtime events appear as they happen, the operator can react before minutes turn into a larger loss. That matters most with unplanned downtime, where fast action often prevents a bigger disruption.
The same is true for quality issues. If defects start increasing, a real-time screen can help the operator catch the pattern early instead of discovering a pile of scrap later. Even simple visibility into stops, slow cycles, and rejects can change the pace of response on the shop floor.
In practice, this means operators should be able to see the issue, record the reason if needed, and get back to normal production quickly. A dashboard that supports those steps helps the line recover faster and keeps losses from spreading across the shift.
Supervisor View – Monitoring Teams and Shift Metrics
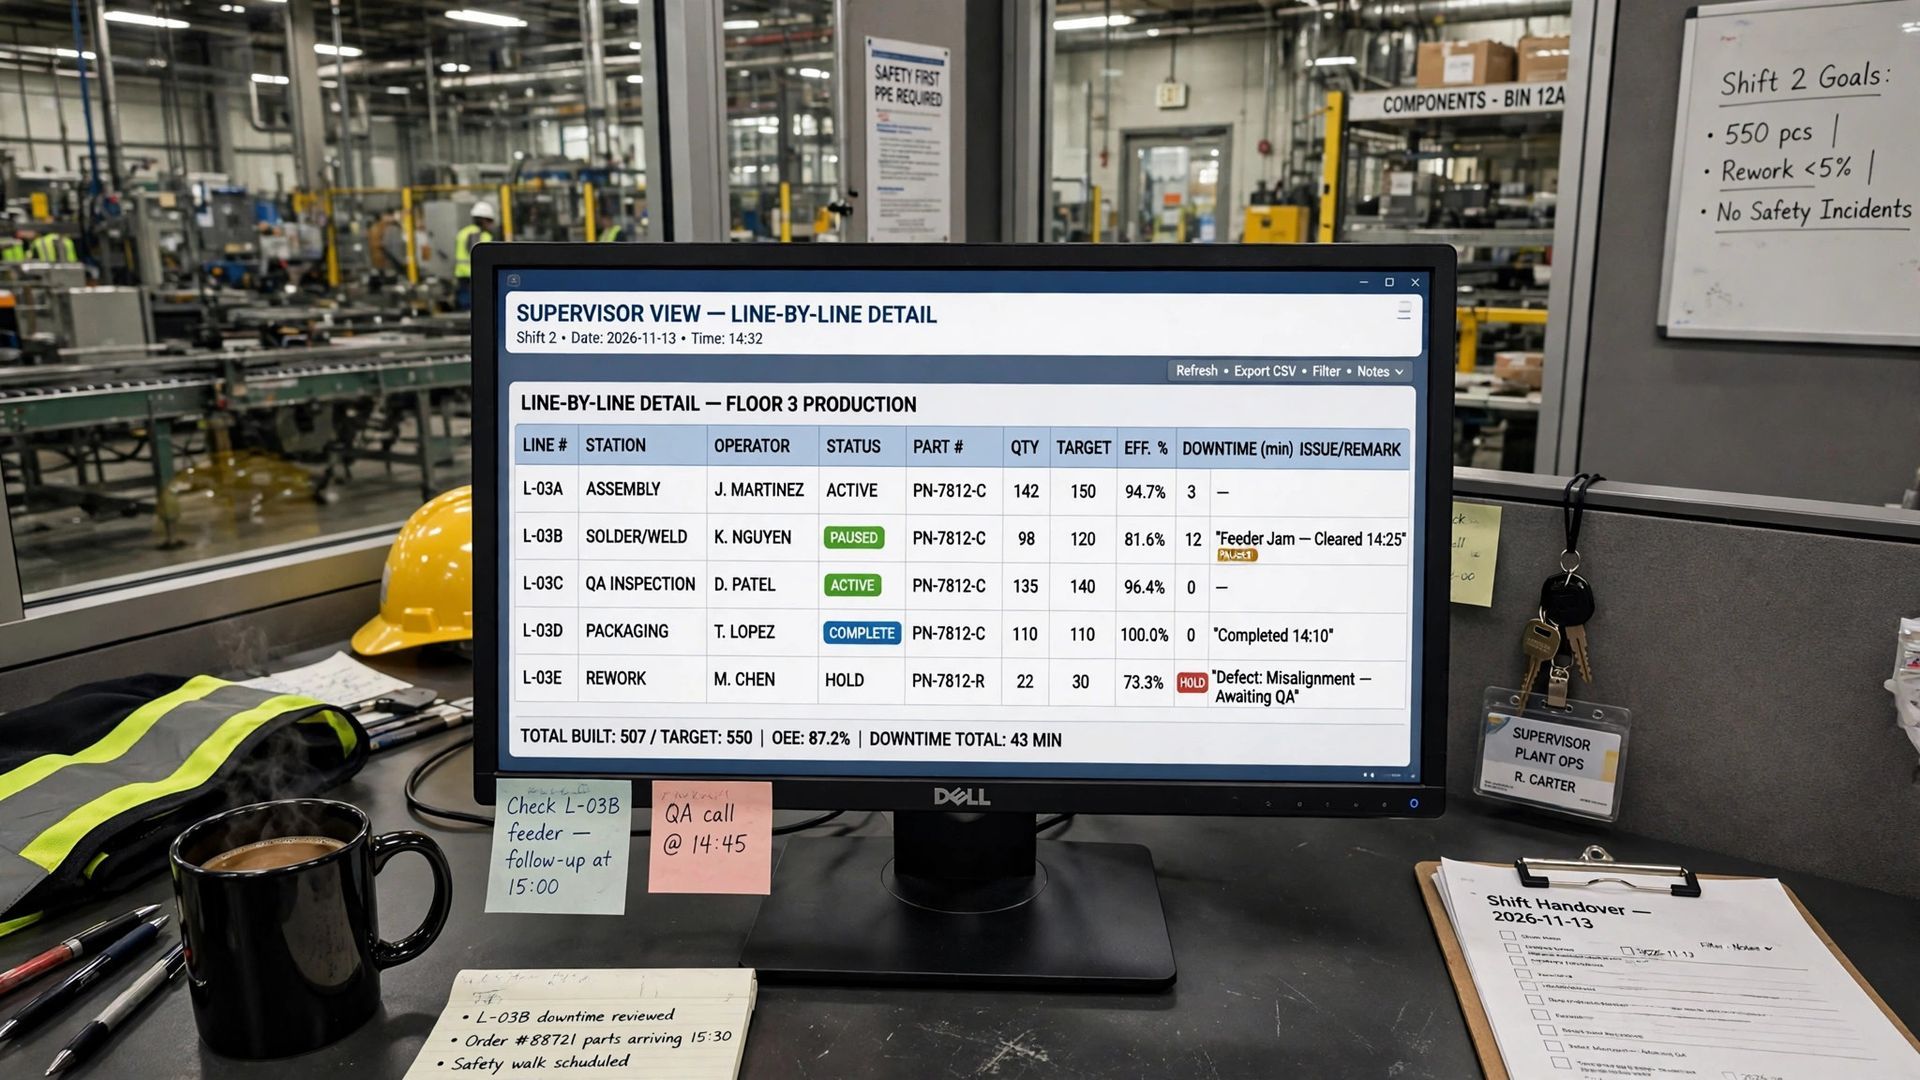
Supervisors need more than a single-machine snapshot. Their job is to watch shift trends, balance response across lines, and keep team performance moving in the right direction. That means their oee dashboards should combine live status with broader views of the shift.
Unlike operator screens, supervisor views should show where operational efficiency is slipping across machines, cells, or crews. They also need enough context to decide whether a problem is isolated or part of a repeated pattern. The next sections cover the essentials.
Aggregated Production Metrics for Supervisors
Supervisors need aggregated metrics that roll up production data from several machines or lines. This lets them compare shift performance without losing time jumping between screens. One area may be on pace while another is falling behind, and that difference needs to be visible fast.
A good supervisor dashboard should still be grounded in the same oee calculation used across the plant. What changes is the level of detail. Instead of one asset, the view summarizes availability, speed, and quality across a crew, cell, department, or shift.
Good data processing also matters here. Supervisors need accurate totals for output, stops, and yield so they can decide where to send support. When the data is reliable, they can see if losses come from one machine, one product run, or a pattern that is affecting the whole shift.
Visualization Tools for Detecting Trends and Issues
Supervisors need visualization tools that show movement over time, not just current status. Live conditions matter, but so do trends. If a line slows down every afternoon or one crew sees more scrap, the dashboard should help that pattern stand out.
This is where historical data and current performance data work together. A supervisor should be able to compare this shift with the last one, review recent losses, and judge whether a problem is getting worse or starting to stabilize. That supports better production efficiency decisions during the day.
Useful supervisor views often include:
- Trend charts by hour, shift, or time period
- Pareto-style views of top downtime or defect drivers
- Side-by-side comparisons across lines or crews
- Summary panels for output, OEE, and quality losses
These visuals make it easier to move from reaction to planned follow-up.
Using Dashboards for Root Cause Analysis Across Shifts
Supervisors often sit at the center of root cause analysis. They hear what happened from operators, but they also need the data to confirm patterns. A dashboard helps by linking downtime events, scrap, and slow cycles to the shift where those losses occurred.
That makes cross-shift review more practical. If one crew reports repeated equipment failures and the next crew sees the same thing, the pattern becomes visible. If quality losses rise only during certain runs or handoffs, the dashboard helps narrow the search instead of leaving the team to guess.
The goal is not to create a long investigation every time output dips. It is to make recurring causes easier to spot. With clear shift trends and event history, supervisors can direct maintenance, coaching, or process checks where they will have the biggest impact.
Manager View – Plant-Level Visibility and Insights
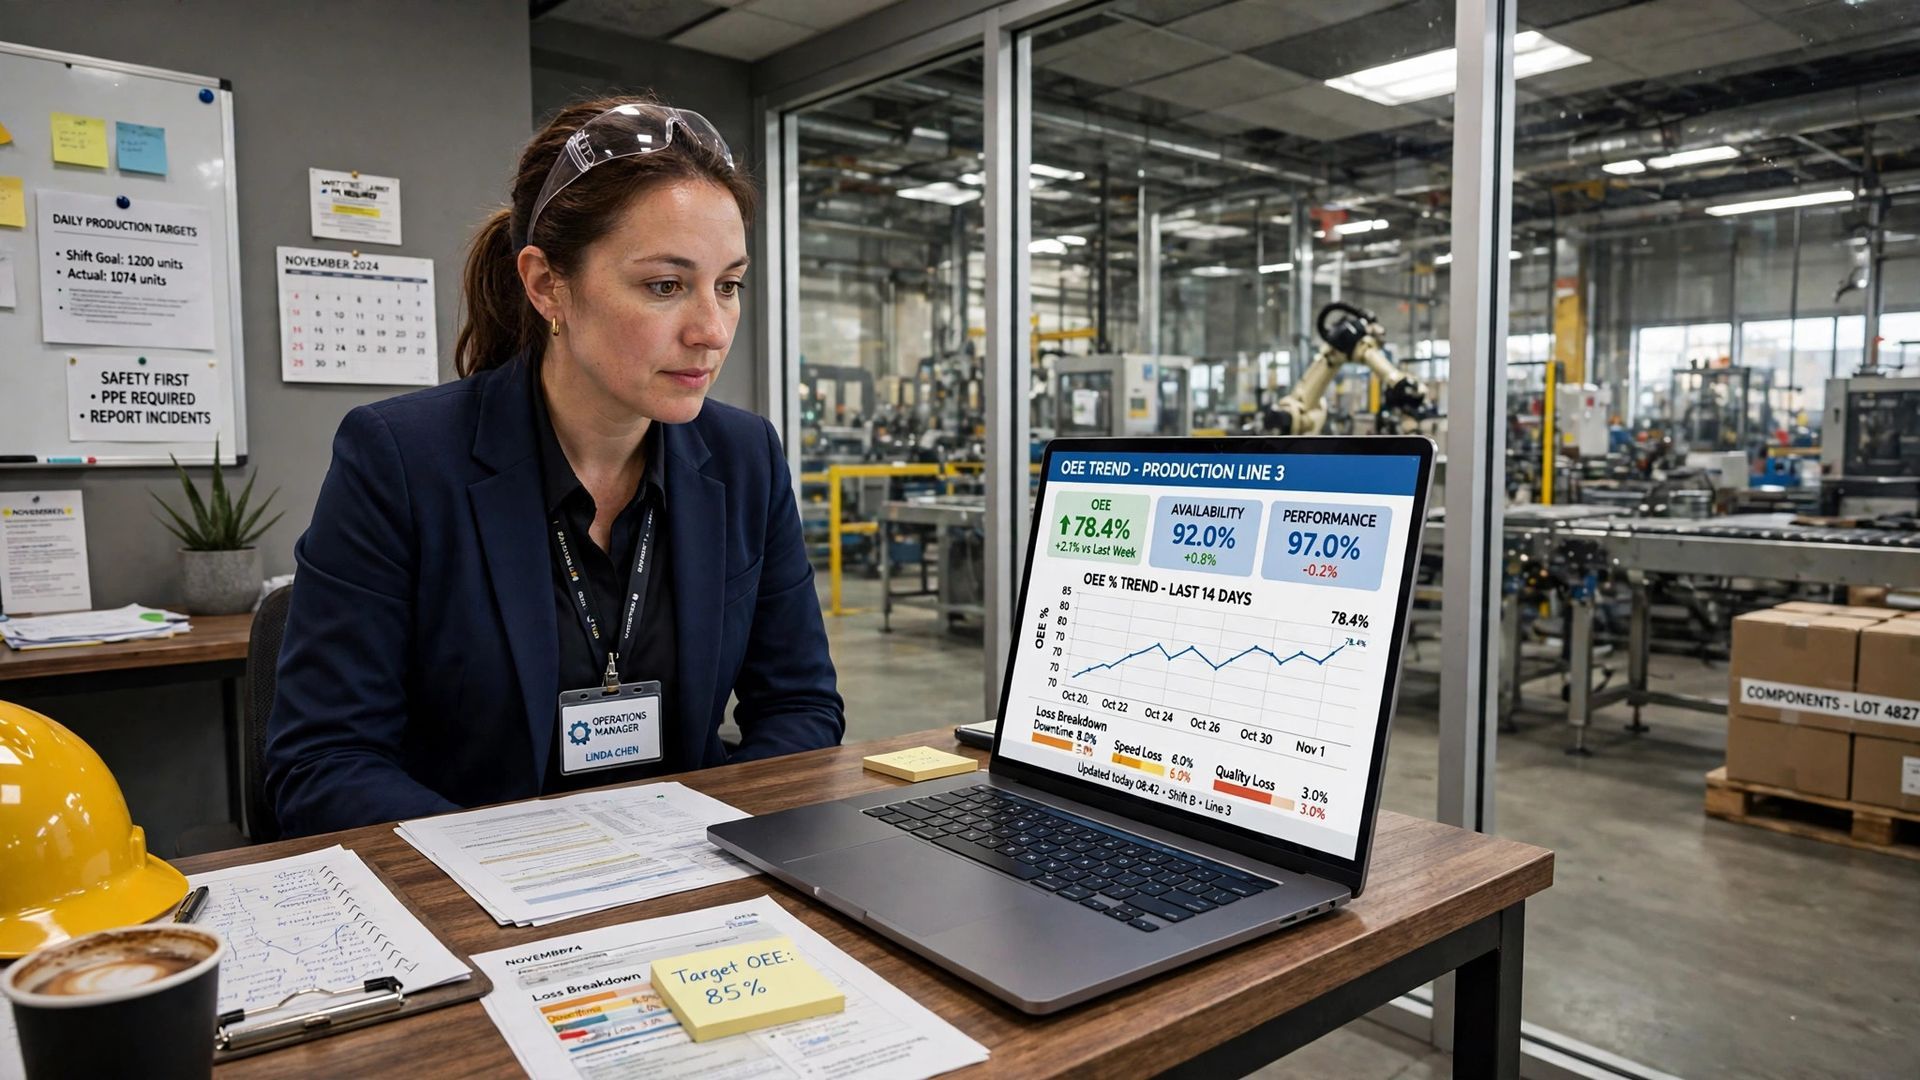
Plant managers need a different view from the floor team. They are looking for plant-level visibility, not machine-by-machine detail. Their oee dashboards should summarize performance across departments, lines, and, in some cases, multiple facilities.
This does not mean less action. It means a different type of action. Managers use summary data to prioritize resources, compare sites, and decide where larger improvement work should start. The sections below focus on executive reporting and strategic analysis.
Multi-Site Monitoring and Executive Reporting
For plant managers, a strong dashboard can scale beyond one line or one building. Multi-site visibility starts with a consistent data model, where each location uses the same OEE logic and similar definitions for stops, output, and quality. Without that, site comparisons are weak.
Once the structure is aligned, the dashboard can roll local performance into site and enterprise summaries. That lets plant managers review production efficiency by facility, by department, or by time period. The result is faster identification of bottlenecks and stronger executive reporting.
This is also where oee reports become useful for leadership reviews. A manager may not need every event from every line, but they do need clear summaries of trends, recurring losses, and improvement progress. For a broader view of overall equipment effectiveness, see https://www.empoweredautomation.com/oee.
AI-Powered Analytics for Strategic Decision Making
AI analytics can add value when the basics are already in place. If your dashboard has clean, consistent oee data, advanced data processing can help managers review patterns faster and support strategic decision making. The key is that AI should help explain performance, not replace sound plant knowledge.
In practice, that means surfacing trends across lines, shifts, or sites that may deserve attention. If repeated slowdowns, scrap spikes, or stop patterns appear in the same context, managers can use that information to prioritize continuous improvement initiatives.
Still, AI is only as useful as the data behind it. A dashboard with poor inputs will not produce trustworthy insight. When machine signals, event history, and production context are connected well, analytics become more valuable for planning reviews, capital discussions, and broader operational decisions.
Conclusion
In summary, understanding the specific needs of operators, supervisors, and managers when it comes to OEE dashboards is crucial for optimizing production efficiency. Each role requires tailored metrics and visualization tools to effectively monitor performance, identify trends, and make informed decisions. By implementing an OEE dashboard that caters to these distinct perspectives, you can enhance communication, improve operational visibility, and drive continuous improvement in your manufacturing processes. For more in-depth insights on OEE dashboards and how they can transform your production environment, visit our OEE pillar page at https://www.empoweredautomation.com/oee and take the first step towards maximizing your operational efficiency today!
Frequently Asked Questions
How is real-time data displayed in OEE dashboards?
A real time oee dashboard displays live data through simple data visualization such as status tiles, trend charts, gauges, and event timelines. It pulls production data from machines, sensors, and inputs, then updates the screen as conditions change so teams can respond during the run, not after it.
Are there open-source OEE dashboard solutions for manufacturers?
Some manufacturers explore open-source tools, but the bigger issue is whether the setup supports dependable data collection and clear oee metrics. In manufacturing, the dashboard only helps if it connects well to equipment, handles role-based views, and gives teams practical visibility without adding complexity.
Can OEE dashboards use AI to analyze manufacturing metrics?
Yes, oee dashboards can use AI to support analytics, but only when the underlying data processing is solid. With clean inputs, AI can help summarize trends, recurring losses, and production performance patterns so managers can focus improvement work where it will have the most value.
You might also like